
Search published articles
Volume 10, Issue 5 (2nd conferences on earthquake engineering (Alborz Province) 2016)
In seismic prone areas, earthquakes happen more than just main shocks which are happen with sequences of shocks include of different intensity of aftershocks. In technical documents, these kinds of several earthquakes are called mainshock-aftershock ground motions. In this study, seismic behavior of RC frame under mainshock-aftershock with different ratios of maximum acceleration of aftershock to maximum acceleration of mainshock was evaluated. In this paper, nonlinear time-history analysis of frame were performed under mainshock-aftershock sequences and then the residual interstory drift ratio for comparing response of frame under seismic sequences was evaluated. The results show that, residual interstory drift ratio of frame, related to intensity of aftershocks to mainshock and enhance of intensity of aftershock due to increase residual interstory drift ratio of frame. Although, growth of residual interstory drift ratio of top stories more significant than below stories of frame.
Volume 11, Issue 1 (Vol. 11, No. 1 Spring 2017 2017)
./files/site1/files/3Extended_Abstract.pdfExtended Abstract
(Paper pages 51-72)
Introduction
Value engineering is considered an efficient alternative to improve design and construction process of urban tunneling projects. Application of value engineering techniques can provide investigating all aspects of a project in a team work, creative and short-time manner which contribute to precisely identify a project’s quality improvement issues, construction time and costs.
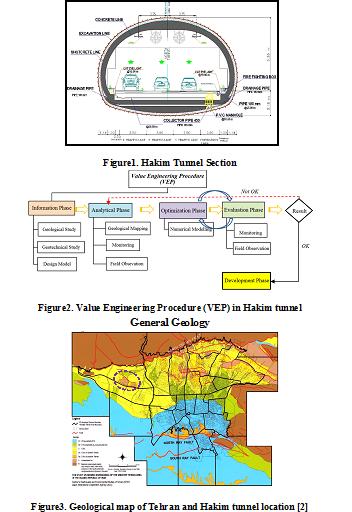
Hakim Expressway one of the capital's main highways in Tehran metropolis with 9 Km in length, starts from the junction of Resalat expressway and Kurdistan expressway after Resalat tunnel and ends in Lashgari expressway. The west extended this highway passing through the area of Chitgar forest park. Due to environmental constraints, the Hakim twin tunnels with cross-section of 186 m2 excavation areas and total length of 3256 m to the NATM/SEM method in this area were excavated (Figure 1).
In preliminary design of Hakim tunnel project, on category of excavation and support system was suggested. During the tunnel’s excavation operation, the behavior and classification of the tunnel were investigated from field observation, instrumentation and monitoring of geological models and subsequently, further excavation process was modified in accordance with value engineering. The aim of using value engineering approach in this project was to reduce the costs without any decrease in quality, employer satisfaction along with minimum risk and as well as improving operational and practical aspects. Ultimately, establishment of the value engineering approach on Hakim tunneling project leads to 10% reduction in construction costs as well as relevant quality with the least challenges (Figure 2).
General Geology
The city of Tehran is founded on Quaternary alluvium, which has been geologically classified by Rieben [1]. The city is located at the foot of the Alborz mountain range, which is basically composed of Eocene pyroclastic deposits (green tuff) and other volcanic rocks. The geology and the morphology of the Tehran region is similar to that for other cities located at the foot of mountains.
Rieben (1966) divided the Tehran coarse-grained alluvia into four categories, identified as A, B, C and D, where A is the oldest and D the youngest (Figure 3).
Hakim tunnel project locates on foothills of northern Tehran, crossing the hills of Chitgar forest park. Results of field surveys indicate that alluvial deposits in tunnel track belong to C (ramps and tunnel portal) and A formations (in most parts of tunnel track).
Geotechnical characterization
Table1 summarizes soil input parameters. Two soil types were considered for the model with 8- meter-height overburden. First layer (No.1) starts from surface with a 1 meter thickness. Second layer (No. 2) has 7 meter thickness.
Table1. Summary of the geotechnical parameters
| Parameter | Unit | Layer No. 1 | Layer No. 1 |
| Internal friction angle (CU) | Deg. | 29 | 33 |
| Cohesion (CU) | Kg/cm2 | 0.15 | 0.45 |
| Density | Kg/cm3 | 18.5 | 20 |
| Poisson ratio of unloading/reloading | Kg/cm2 | 0.2 | 0.2 |
| Secant deformation modulus | Kg/cm2 | 550 | 900 |
| Power of stress level of stiffness | 0.5 | 0.5 | |
| Stiffness unloading | Kg/cm2 | 1650 | 2700 |
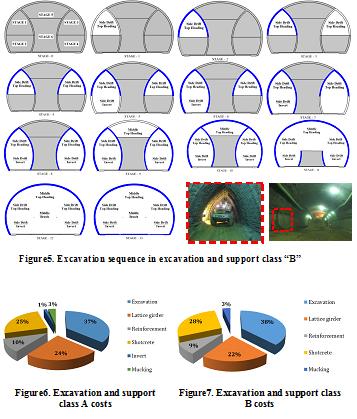
Detailed analysis before excavation and continuation of studies led to two excavation and support classes purposed for Hakim tunnel. Both classes of excavation and support due to ground conditions are modeled and analyzed using software Plaxis. For verification, the results of numerical analysis using monitoring and field observations were compared during the tunnel excavation. The results of monitoring compliance with the results of numerical analysis were appropriate.
Implementation and construction costs were calculated for different sections of two excavation and support classes in accordance to contraction documents to evaluate the effect of optimization in design (Figures 6, 7)
.jpg)
Figure4. Excavation sequence in excavation and support class “A”
Results
Results indicate that in both classes maximum costs are related to excavation section while minimum costs are for invert and mucking. In all concrete spray operations there was just a %3.5 increase in costs. Overall savings in excavation and support was about %10 which is significant (Figure 8).

Figure8. Savings percentage comparison in excavation and support classes A and B
Volume 11, Issue 1 (Vol. 11, No. 1 Spring 2017 2017)
./files/site1/files/4Extended_Abstract.pdfExtended Abstract
(Paper pages 73-90)
Introduction
Up to now, various indexes and methods have been presented for evaluating the abrasivity of rocks. In total, these methods can be divided to two main groups; the methods based on nature of rocks, methods based on heuristic tools. Schimazek F-abrasivity index is one of the most powerful and applicable indexes for evaluating the rock abrasiveness. This index uses the grain size, Brazilian tensile strength and equivalent quartz content for abrasivity analysis. Since the values of these parameters are equal in Schimazek index, therefore, in some cases this index doesn't have suitable ability to distinguish and classify the rock abrasiveness. This paper tries to modify the Schimazek index considering the weights of its applied parameters.
Material and Methods
In this research, Fuzzy Delphi Analytical Hierarchy Process (FDAHP) has been used to calculate the weight of dominant parameters in rock abrasivity. For this purpose several questioners have been distributed and the expert opinions were collected. The results showed that the quartz content, grain size and tensile strength have the weight of 0.4, 0.31 and 0.29 respectively and new Schimazek F-abrasivity index is as presented in equation (1).
.jpg)
In the next stage, in order to facilitate the application of new index, a new classification system was developed. This classification and related weighing graphs (Figure 1) help to change the discontinuous classification to continuous one.
Results and discussions
In order to verify the application of the new developed index, ten ornamental stones have been studied and the old and modified Schimazek indexes were calculated for all of them. Then, the cutting rate (sawing rate) of each stone was recorded in laboratory and the mathematical relationships between new and old indexes have been achieved. The results show that the new Schimazek abrasivity index has higher ability to predict the cutting rate than old one (Figure 2).
.jpg)
Figure1. Continuous weighting for parameters of Schimazek F-abrasivity index
.jpg)
Figure2. Regression of old and new Schimazek F-abrasivity index with cutting rate of granite ornamental stones
Conclusion
Generally it could be concluded that, the main weakness of Schimazek F-abrasivity index which is the equality of parameters’ importance, has been removed by idea developed and confirmed in this study. The different weights which allocated to grain size, Brazilian tensile strength and equivalent quartz content in study, improves the Schimazek index applicability in rock engineering applications specially rock cutting and drilling. Therefore, it is recommended to use new method instead of old one in future applications.
Volume 11, Issue 2 (Vol. 11, No. 2 Summer 2017 2017)
./files/site1/files/1.pdfExtended Abstract
(Paper pages157-174)
Introduction
Considering the fact that the estimation of mode
Materials and Methods
The tests were carried out on six types of rocks, namely gray sandstone,
tuff, lithic tuff, travertine, andesite, and limestone. Sandstone, travertine, and limestone are sedimentary rocks, while andesite is an extrusive igneous rock, and tuff and lithic tuff are pyroclastic rocks (pyroclastic rocks resulting from volcanic eruptions that harden by sedimentation). Therefore, the studied rocks have different origins. In order to carry out the Brazilian and the three-point bending test, cores were prepared from these blocks. In order to perform the three-point bending test, specimens with diameter of 73 mm with a thickness of 30 mm were used. The samples were cut in two semicircular by a cutting machine, and a notch with length of 15 mm is created by a diamond saw. Notch is vertical in the center of the semicircular samples.
The Brazilian test was performed on disc shaped specimens. In order to perform the Brazilian test, specimens with diameter of 51 mm and thick of 25 mm were used. The specimens are carefully placed under the curved jaws of the machine and then loaded until fracture.
Results and Discussion
A summary of the Brazilian and the three-point bending test results are presented in Table 1. The average value of test result pertaining to each rock is reported in Table 1.
Table 1. Summary of the Brazilian and the three-point bending test results
| Specimen | Tensile Strength (MPa) | Fracture Toughness (MPa√m) |
| Limestone | 3.74 | 1.23 |
| Sandstone | 7.14 | 1.63 |
| Tuff | 16.36 | 2.17 |
| Lithic Tuff | 4.34 | 1.01 |
| Andesite | 13.25 | 1.86 |
| Travertine | 8.27 | 1.14 |
In order to determine the relationship between the tensile strength and the fracture toughness, the tensile strength vs. fracture toughness diagram was plotted in Excel to obtain Eq. 1 and the coefficient of determination (R2) (Figure 1).
.jpg)
The coefficient of determination (R2) in Eq. 1 shows that almost 80 percent of the mode I fracture toughness variations can be estimated using the linear relationship (Eq. 1). The relationship is applicable for determining the mode I fracture toughness resulting from the three-point bending test on semicircular specimens containing a straight crack.
.jpg)
In the following, the results of this study are compared to those reported by Whittacker (1992) and Zhang (2002).
In order to examine the accuracy of the presented relationships, the Root Mean Square Error (RMSE) measure was used which is computed from Eq. 2. In the best case, RMSE is zero.
.jpg)
In the relationships,
Comparison of the obtained results indicate that the proposed relationship has the capability of precise estimation of the mode I fracture toughness of rocks.
Conclusion
Given the many difficulties associated with the direct estimation of fracture toughness, indirect estimation methods have been proposed. One of such methods is the estimation of mode I fracture toughness using tensile strength. A linear relationship with a coefficient of determination of 0.7977 was proposed. The accuracy of this relationship has been verified by comparing its results to those from previous studies.
Volume 12, Issue 5 (English article specials 2019)
In the mechanized boring method, the factors affecting ground surface settlement can be mainly divided into five categories: geometric, geomechanic, boring machines working, operating and management parameters. In urban tunnels bored mainly in shallow soil bed, face pressure can be one of the factors preventing ground settlement. The Line A tunnel in Qom metro project is bored with an EPB (Earth Balance Pressure) mechanized boring machine. The effect of face pressure on ground surface settlement was analyzed in the present study according to five sections of the tunnel. These five sections were selected in different kilometers of the tunnel where settlement gauges were installed and the results could be validated. To investigate the effect of face pressure on maximum ground surface settlement, four pressure levels of 100 kPa, 150 kPa, 200 kPa, and 400 kPa were taken into consideration. These were 1, 1.5, 2, and 4 times of the initial face pressure level, respectively. The ground surface settlement was assessed at four pressure levels using the finite element software, PLAXIS 3D TUNNEL. The results were validated using ground-level instrumentation (settlement gauges) on all sections. The validation showed that the modeling results are in good agreement with the results obtained from settlement gauges. Comparison of the results indicated that a 4-fold increase in the face pressure led to a maximum decrease of 4.45 mm in the maximum settlement. Therefore, an increase in the face pressure can reduce settlement, although quite minimally. It was also found that an over-increased face pressure (face pressure over 200kPa) not only did not reduce the maximum ground surface settlement but also may lead to passive failure or uplift of ground surface ahead of the shield.
Volume 13, Issue 3 (Vol. 13, No. 3 2019)
Introduction
Unsystematic execution of blasting process may result in serious damages. Blasting is a very complex process and almost all of blast designs are made based on empirical relations resulting from trial and error. In recent decades, considerable development of numerical methods has been made possible to achieve high accuracy study of blast effects on surface and subsurface structures. Among these methods are boundary element method, finite difference method and finite element method. It should be mentioned that there is currently no software which might be able to completely simulate blast process. But the UDEC software is able to simulate different aspects of this phenomenon through simplification and focusing on each aspect. Therefore, the UDEC software was selected. In the present study, the modeling has been performed for Ghareh Changool ramp of Zehabad Zinc and Lead Mine against blast loads.
Material and methods
Zehabad Ore deposit is located around 2 km south of Zehabad Village of Tarom Sofla County, 56 km to northwest of Qazvin at 49˚ 25' east longitude and 36˚ 28' north latitude.
The formation surrounding the ore deposit is generally made up of pyroclastics, lavas and sedimentary rocks of Eocene age (Karaj Formation) which have been divided into 22 stratigraphic units. Lithological composition of the tuff units are often rhyolithic to dacitic and the lava units are consisted of rhyolite, dacite and andesite.
To accomplish this study, we took rock blocks from Ghareh Changool ramp. Then, the blocks were cored in the laboratory to provide cylindrical samples for doing uniaxial compressive, triaxial, Brazilian and direct shear tests. Physical and mechanical properties of the tuff samples were determined according to ISRM standards.
In the present study, field studies were done to calculate strength parameters and properties of the joints. Based on these studies, three major joint sets were determined. In order to obtain the shear strength parameters of the joints, the cylindrical samples of andesitic tuff were molded by concrete and direct shear test was done on all of the joints according to ASTM D 4554.
Results and discussion
To simulate the complex conditions of blast process, we used the discrete element software of UDEC for numerical modeling considering the discontinuity of the medium. To do a dynamic analysis, first the model should come to equilibrium in the static state. The space considered to be modeled in the study was a horse-shoe-shaped ramp with 4 m base, 4 m height and 1.5 m arc radius which was located in rocky medium consisting of tuff. The height of overburden above the roof of the ramp was about 190 m. The dimensions of the model in UDEC was 20*20 m2. The behavioral model considered for the rock blocks and discontinuities were the elastic isotropic and surface contact of the joint (elasto-plastic) associated with Coulomb sliding failure, respectively. After defining the absorbing boundary conditions, the dynamic loads were applied to the model based on the defined time period. In mines stability and blasting process, the dynamic load resulting from the blast is often applied to a model as a pulse. By application of dynamic load and considering the other mentioned variations with respect of static analysis, the dynamic response of underground space could be estimated under vibration load of blast or earthquake. To do this, the blast impact wave was applied to the left side of the model as exponential pulse with maximum pressure of 4.41 MPa and time width of 0.7 to 7 msec. The results of the numerical modeling in static analysis indicated that no block would fall (Fig. 1). After application of the blast load, the results showed that there was no falling around the ramp (Fig. 2).
Conclusion
1. In static condition, after initial equilibrium no block was fallen into the ramp, regarding the blocks’ magnification plots, as a result the ramp was stable in the static loading.
2. In dynamic loading case, considering the displacement plots around the ramp and the low values of these displacements, as well as, magnification plot of the blocks 40 msec after the blast it can be said that no block was fallen into the ramp. Therefore the ramp was stable in the dynamic loading case and there was no need to install support system. ./files/site1/files/133/1Extended_Abstracts.pdf
Volume 13, Issue 5 (English article specials 2020)
One of the effective parameters in the dynamic behavior of reinforced soil walls is the fundamental vibration frequency. In this paper, analytical expressions for the first three natural frequencies of a geosynthetic reinforced soil wall are obtained in the 3D domain, using plate vibration theory and the energy method. The interaction between reinforced soil and the wall is also considered by modeling the soil and the reinforcement as axial springs. The in-depth transverse vibration mode-shapes, which were impossible to analyze via 2D modeling, are also analyzed by employing plate vibration theory. Different behaviors of soil and reinforcements in tension and compression are also considered for the first time in a 3D analytical investigation to achieve a more realistic result. The effect of different parameters on the natural frequencies of geosynthetic reinforced soil walls are investigated, including the soil to reinforcement stiffness ratio, reinforcement to wall stiffness ratio, reinforcement length, backfill width and length to height ratio of the wall, using the proposed analytical expressions. Finally, the results obtained from the analytical expressions proposed are compared with results from the finite element software Abaqus and other researchers’ results, showing that the proposed method has high accuracy. The proposed method will be a beginning of the 3D analytical modeling of reinforced soil walls.
Volume 13, Issue 5 (English article specials 2020)
In cases such as explosion, fire, deep drilling and geothermal energy extraction, rocks are exposed to high temperatures influencing the rock toughness. Thus, the aim of this study is to investigate the effect of temperature on the fracture toughness of the rocks. In this study, the effect of temperature on the mode I fracture toughness is investigated. To this end, three-point bending tests were performed on semicircular specimens of four types of natural rocks including sandstone, limestone, tuff, andesite, and a series of concrete specimens to determine the fracture toughness. The specimens were first heated to 100, 200, 300, 500 and 700 °C. After reaching the desired temperatures, the specimens were cooled. A series of tests was performed on the specimens at ambient temperature (25 °C). The heating rate in the electric furnace was 15 °C/min in accordance with the temperature rise in fires. Petrographic studies and X-ray diffraction analysis (XRD) were performed to identify the composition of the rocks. Furthermore, the effective porosity and the weight loss of heated specimens were determined to study the behavior of rocks. Comparison of the test results indicated the higher impact of temperature on the fracture toughness of fine-grained rocks. In addition, the fracture toughness decreased by increasing the effective porosity and decreasing the weight loss. According to the results, the mode I fracture toughness of sandstone, tuff, limestone, andesite and concrete specimens underwent a heating-cooling cycle up to 700 °C respectively decreased 45, 17, 44 and 9.5 and 37 percent compared with that of unheated specimens.
Volume 14, Issue 4 (1-2021)
Introduction
Series A of coarse-grained alluvial deposits of Tehran are extended in eastern and north-eastern areas of Tehran. Analyzing and studying of these alluvial deposits from a geological point of view as well as their creation time and general characteristics such as the deposits’ mineral types, their source, and formation conditions, gives a better point of view to geotechnical engineers about exploring their characteristics as well as geotechnical aspects in underground structure design, excavations, and foundation design processes. On the other hand, in order to analyze stability, estimating the factor of safety and the seismic design of these structures, considering their location, which is in Tehran with a high seismic hazard area, the necessity of knowing the exact mechanical and dynamic properties of Tehran's alluvium is felt more than ever.
Material and methods
Due to the grain size of Tehran’s coarse-grained alluviums (series A) as well as high level of cementation of them, it is impossible (or maybe so difficult) to make undisturbed samples in order to do experiments. Such that it is excavated 23 boreholes with 30 to 140 meters depth as well as 17 test wells with 20 meters depth in an area which was extended in 10 kilometers in long which were located in Tehran’s No. 13 and No. 14 districts (as it can be seen in Figure 1). During the excavation of the entrance ramp and tunnel of eastern highway of Tehran, in-situ tests have been done in different sequences. Since it was important to investigate real behavior of these alluviums, different in-situ tests such as plate load test, in-situ shear test, pressuremeter test, and downhole test have been done as well as many laboratory and field tests. Furthermore, (1) X-Ray Diffraction (XRD) and (2) X-ray Fluorescence (XRF) as well as (3) Scanning Electron Microscopy (SEM) methods, have been used to explore the type of minerals and those used in cementation.

(ب)
Figure 1. a) Geological plan and the location of boreholes and test wells in the alignment of East Tehran Freeway
Results and discussion
Based on the results of XRD tests, it is quite clear that the largest weight percentages of tested samples are lime and silica.
Calcium and magnesium levels-as the high-power cations in flocculation process-in soil sample No. 1 (soil with high cementation level) are much more than soil sample No. 2 (soil with moderate cementation level).
This is the cause of high cementation level of soil sample No. 1 comparing with soils sample No. 2. A rapid increase in stress level can be seen in in-situ shear test results, in low shear displacements, up to reaching a maximum of τp (peak point) and afterwards reduction in shear stress with softening behavior.
Cohesion and shear strength levels also increase by increasing the depth. According to the plate load tests results, an increase in soil modules changes can be seen in different depths by depth increasing.
Large tendencies to increase in volume and dilation can be seen in under shear load cemented soils, after applying a primary compression on them. A brittle behavior with the occurrence of a certain peak can be seen in cemented samples. The significant increase in strength is directly related to the severe dilation rate, which can be seen in cemented samples results. The shear strength would be decreased, if this cement is broken during the particles’ displacements.
The results of downhole tests are shown in Figure 2. According to this figure, it has been explored that Vs,30 is about 600 m/s in moderate cemented soils while it is about 850 m/s in highly cemented soils. Because of the homogeneity and uniformity of sedimentary deposits, shear wave velocity is increasing due to the higher density of the layers and high level of cementation in both of the soil types. However, this increase is not significant at depths above 25 meters.
Conclusion
Based on the results, cementation level of the eastern coarse-grain-alluvium of Tehran is moderate to high and minerals used in cementation of this type of soil are generally carbonated and especially calcite.
Investigating the level of cementation of soil as well as the results of chemical analysis and in-situ tests, it can be found that the strength and deformation parameters of the soil are directly related to the degree of its cementation.
Based on the obtained results, the deformation modulus increases by about 25%, the cohesion by about 55% and the shear wave velocity by about 30% with increasing the degree of cementation (Table 1).
Increases of these parameters are directly related to depth. However, the cementation level does not significantly affect the internal friction angle of the soil.
Table 1. Average results of in-situ shear tests
| Deformation Modulus (MPa) | Peak Friction Angle (deg.) | Cohesion (kPa) |
USCS | Depth (m) |
Sample |
| 50-60 | 39 | 30-35 | GW-GM | 5 | Moderately Cemented Soil (M.C. Soil) |
| 75-85 | 41 | 50-60 | SP-SC | 10 | |
| 85-90 | 41 | 50-60 | GW-GC | 15 | |
| 95-105 | 41 | 50-60 | GW-GC | 20 | |
| 60-70 | 39 | 35-40 | GW-GM | 5 | Highly Cemented Soil (H.C. Soil) |
| 75-85 | 39 | 50-60 | GW-GC | 10 | |
| 110-120 | 42 | 65-75 | GW-GC | 15 | |
| 125-140 | 41 | 110-120 | GC | 20 |
Volume 16, Issue 1 (5-2022)
Many researches have been currently conducted on the effects of fault distance on structures revealing that their seismic response can differ according to their distance from the fault. Suspension bridges due to their long period and high flexibility can be more sensitive to this phenomenon, especially in vertical vibration. Since the engineers tend to use longer spans, the length factor should be studied more accurately. In this paper, the effects of length factor on the seismic response of the suspension bridge under near and far-fault ground motions were addressed. The Vincent Thomas and Golden Gate suspension bridges as short and long ones, respectively, are selected as the case studies. The seismic responses of two bridges under five main worldwide ground motions contained both near and far-fault ones, with the same peak ground’s acceleration, are evaluated. The results indicated that the response of both bridges to the near and far-fault ground motions are perfectly different. Short span suspension bridges are vulnerable to near-fault ground motions, whereas long span ones are completely susceptible to both near and far-fault ground motions, and by increasing the length of span, the sensitivity of bridge was increased against far-fault low frequency excitations. Also, maximum displacement responses of spans in both bridges did not increase by maximizing peak ground’s acceleration.
| Page 1 from 1 |
Related Websites
Site Keywords
نشریه, Academic Journal, Scientific Article, کلمه شماره یک, کلمه شماره یک, کلمه شماره یک, کلمه شماره یک, کلمه شماره دو, کلمه شماره یک, کلمه دوVote

© 2024 CC BY-NC 4.0 | Journal of Engineering Geology
Designed & Developed by : Yektaweb