
Search published articles
Showing 7 results for Sadeghi
H Gh, H Sadeghi,
Volume 7, Issue 1 (8-2013)
Volume 7, Issue 1 (8-2013)
Abstract
Wave velocity and attenuation are among the most important attributes of stress waves that propagate through geomaterials. Utilizing these attributes, it is possible to acquire useful information about porous geomaterials such as soil and rock and also the fluids that saturate the pores of geomaterials. The key point in order to gain this information is to establish an accurate link between field measurements of wave attributes and physical properties of geomaterials’ skeleton and pore fluid. The pore fluids and their inhomogeneous distribution fluid are among factors that affect wave velocity and attenuation to a considerable extent. Patchy saturation of pores which occurs on the scale larger than grains size but smaller than wavelength is one of the reasons that causes inhomogeneity in pore fluid distribution. The influence of such inhomogeneity is studied in present paper. Two different attenuation mechanisms including relative movement of fluid with respect to solid phase and also attenuation caused by grain to grain contact are implemented to fully assess wave attenuation. It is observed that the former attenuation is more dominant at higher frequencies compared to the latter attenuation.
H Sadeghi, S Mahdevari,
Volume 7, Issue 1 (8-2013)
Volume 7, Issue 1 (8-2013)
Abstract
One of the major challenges in tunneling is the excavation in regions with high potential of squeezing and in the case of application of full face boring machines evaluation of the required thrust in these regions is inevitable. The Beheshtabad water conveyance tunnel with 65 km in length is considered for transferring one billion cubic meter of water annually to the central part of Iran. According to geological investigation there is a high potential of squeezing in the 19th section of tunnel. In this article, the thrust evaluation methods are investigated and the required penetration force is calculated. Then the numerical procedure applicable to thrust evaluation in the 19th section is discussed and the results are analyzed. In addition, the required thrust to overcome shield skin frictional resistance using Ramoni's method (2010) is computed and the outputs are compared to numerical ones. As a result of numerical simulation, in order to utilize double shield TBM for the sections of 29030-31600 km and 34900-37490 km, it is required to overcut 3 cm for the favorable geomechanical locations and 10 cm for the unfavorable geomechanical conditions. Decision on the application of full face boring machines in the section of 31600-34900 km could be made providing long term parameters of host rock were determined via performing additional in situ tests in the exploration gallery.
Ar Yarahmad, S Kakamami, J Gholamnejad, Mt Ssadeghi, Majid Mobini,
Volume 8, Issue 3 (12-2014)
Volume 8, Issue 3 (12-2014)
Abstract
The in situ measurement of discontinuity geometry of rock mass exposures is a time consuming and sometimes hazardous process. Moreover, a large proportion of the exposure is often inaccessible. Thus, a fast and safe tool is required in order to acquire the information which characterizes the geological/structural regime. Digital image processing techniques provide the necessary tools for realizing this goal. This paper presents a methodology for automated discontinuity trace detection in digital images of rock mass exposures. In this study at first based on difference in gray level discontinuities with the face, fracture traces detected in images of rock face. Then some parameters of discontinuities geometry such as spacing, linear joint density, persistence, trace angle of joints and value of RQD are obtained. The Automated discontinuity geometry analysis system including: 1- Providing a digital image from rock face 2- The pre-processing on the images 3- Detection of edge or joint traces by the canny detector 4- Description of the edges using line detector by the Hough transform 5- The joint sets estimation using fuzzy methods and 6- Description the rock mass geometry properties.
R. Yazdanfar, N. Hafezi Moghadas, H Sadeghi, Mr Ghayamghamian,
Volume 9, Issue 4 (3-2016)
Volume 9, Issue 4 (3-2016)
Abstract
The average of shear wave velocity of the upper 30 m has so far been one of the reliable parameters in seismic site classification in different building codes, despite the numerous weaknesses in the exact explanation of site dynamic characteristics. In this study, an empirical relationship is obtained between the average of the shear wave velocity of the upper 30 m and the average of the shear wave velocity of shallower depths, based on 79 shear wave velocity profiles, in Mashhad. This is followed by the recommendation of proper depths for the dynamic analysis of the site effect based on the information of shear wave velocity profiles and resonance period distribution in the investigated area. The depth of the S-wave velocity profile investigation, required for the analysis of deposit effects has been estimated more than 30 m. whith exception of the southern and western parts of Mashhad (adjacent hillsides). Such depth is estimated as about 80 m for central, eastern, and north-eastern areas, where the resonance period is more than 0.7 s. Therefore, investigation depth of 30 m is only adequate for site classification based on the building codes, and for theoretical analysis deeper studies is needed, in Mashhad
Majid Taromi, Maziar Hosseini, Seyed Mahdi Pourhashemi, Majid Sadeghi,
Volume 11, Issue 1 (Vol. 11, No. 1 Spring 2017 2017)
Volume 11, Issue 1 (Vol. 11, No. 1 Spring 2017 2017)
Abstract
./files/site1/files/3Extended_Abstract.pdfExtended Abstract
(Paper pages 51-72)
Introduction
Value engineering is considered an efficient alternative to improve design and construction process of urban tunneling projects. Application of value engineering techniques can provide investigating all aspects of a project in a team work, creative and short-time manner which contribute to precisely identify a project’s quality improvement issues, construction time and costs.
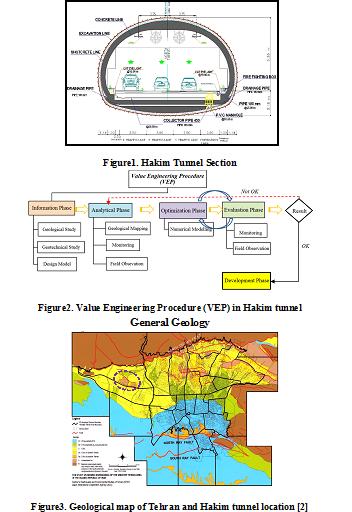
Hakim Expressway one of the capital's main highways in Tehran metropolis with 9 Km in length, starts from the junction of Resalat expressway and Kurdistan expressway after Resalat tunnel and ends in Lashgari expressway. The west extended this highway passing through the area of Chitgar forest park. Due to environmental constraints, the Hakim twin tunnels with cross-section of 186 m2 excavation areas and total length of 3256 m to the NATM/SEM method in this area were excavated (Figure 1).
In preliminary design of Hakim tunnel project, on category of excavation and support system was suggested. During the tunnel’s excavation operation, the behavior and classification of the tunnel were investigated from field observation, instrumentation and monitoring of geological models and subsequently, further excavation process was modified in accordance with value engineering. The aim of using value engineering approach in this project was to reduce the costs without any decrease in quality, employer satisfaction along with minimum risk and as well as improving operational and practical aspects. Ultimately, establishment of the value engineering approach on Hakim tunneling project leads to 10% reduction in construction costs as well as relevant quality with the least challenges (Figure 2).
General Geology
The city of Tehran is founded on Quaternary alluvium, which has been geologically classified by Rieben [1]. The city is located at the foot of the Alborz mountain range, which is basically composed of Eocene pyroclastic deposits (green tuff) and other volcanic rocks. The geology and the morphology of the Tehran region is similar to that for other cities located at the foot of mountains.
Rieben (1966) divided the Tehran coarse-grained alluvia into four categories, identified as A, B, C and D, where A is the oldest and D the youngest (Figure 3).
Hakim tunnel project locates on foothills of northern Tehran, crossing the hills of Chitgar forest park. Results of field surveys indicate that alluvial deposits in tunnel track belong to C (ramps and tunnel portal) and A formations (in most parts of tunnel track).
Geotechnical characterization
Table1 summarizes soil input parameters. Two soil types were considered for the model with 8- meter-height overburden. First layer (No.1) starts from surface with a 1 meter thickness. Second layer (No. 2) has 7 meter thickness.
Table1. Summary of the geotechnical parameters
| Parameter | Unit | Layer No. 1 | Layer No. 1 |
| Internal friction angle (CU) | Deg. | 29 | 33 |
| Cohesion (CU) | Kg/cm2 | 0.15 | 0.45 |
| Density | Kg/cm3 | 18.5 | 20 |
| Poisson ratio of unloading/reloading | Kg/cm2 | 0.2 | 0.2 |
| Secant deformation modulus | Kg/cm2 | 550 | 900 |
| Power of stress level of stiffness | 0.5 | 0.5 | |
| Stiffness unloading | Kg/cm2 | 1650 | 2700 |
Detailed analysis before excavation and continuation of studies led to two excavation and support classes purposed for Hakim tunnel. Both classes of excavation and support due to ground conditions are modeled and analyzed using software Plaxis. For verification, the results of numerical analysis using monitoring and field observations were compared during the tunnel excavation. The results of monitoring compliance with the results of numerical analysis were appropriate.
Implementation and construction costs were calculated for different sections of two excavation and support classes in accordance to contraction documents to evaluate the effect of optimization in design (Figures 6, 7)
.jpg)
Figure4. Excavation sequence in excavation and support class “A”
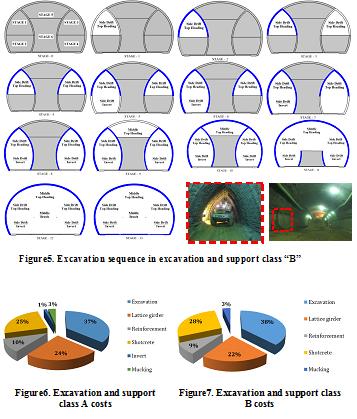
Results
Results indicate that in both classes maximum costs are related to excavation section while minimum costs are for invert and mucking. In all concrete spray operations there was just a %3.5 increase in costs. Overall savings in excavation and support was about %10 which is significant (Figure 8).

Figure8. Savings percentage comparison in excavation and support classes A and B
Ali Saket, Seyed Mahmud Fatemi Aghda, Ahmad Fahimifar, Hossein Sadeghi,
Volume 14, Issue 4 (1-2021)
Volume 14, Issue 4 (1-2021)
Abstract
Introduction
Analysis of time, location and magnitude of foreshocks and aftershocks has been one of the most important cases for experts in various scientific fields such as: seismology, structural engineering and crisis management, and other interrelated fields. Since this analysis and the result of studies on seismotectonic and cases of earthquakes help us identify the foreshocks and aftershocks with the goal of decreasing losses and nervious stress of the injured community in quake-stricken areas and skilled crisis management. The cause fault of earthquake plays the important role in foreshocks and aftershocks of the earthquake. So, study on fault behaviour is a suitable method for analyzing and routing the basic parameters of foreshocks and aftershocks. Also, foreshocks and aftershock are important parts of any earthquake in a seismic area. The analysis of the basic parameters of the foreshocks is one of the most practical researches for reducing the risk of earthquakes. The identification of behavioral pattern of foreshocks can help researchers detect the active fault conditions for the occurrence of earthquakes in different areas. The present study is concerned with the study of behavioral patterns earthquakes, foreshocks, and aftershock of Zohan earthquake. Experience of large aftershocks in different parts of the world indicates that, following earthquakes and depending on seismic-tectonic conditions, large aftershocks are likely to occur in the earthquake-effected zone, which will aggravate the damage caused by earthquakes (Omi et al., 2013). The main factor contributing to the worsening of damage caused by aftershocks is the performance of structures that are weakened but not destroyed by main earthquakes and are, thus, highly likely to be destroyed by large aftershocks (Saket and Fatemi Aghda, 2006).
Material and methods
The present paper makes use of data collected in a real earthquake and similar expriences in other earthquakes for presenting a practical pattern for predicting primary earthquake patterns, determining the location, magnitude, and time of aftershocks. The target of this case is decreasing the effects of earthquake. To this end, we used the results from studies on basic parameters of foreshocks and aftershocks of Zohan earthquake, and 2012 earthquake in South Khorasan province. The rationale for selecting the aforementioned studies is: location of event, the Zohan earthquake, had been identificated as an area with high risk for the occurrence of earthquakes, although there has been no wide-scale earthquake in this area in the last two decades. These conditions are important causes for more concentrated studies on this area because there is a high chance for wide-scale earthquakes striking this area.
Result and Discussion
In this part of research, we conduct a study on the location, magnitude and depth of foeshocks. Some of the world-wide research suggested that these data can help to predict the time of mainshocks. Studies conducted on the variations of frequency in foreshocks can follow this goal.
In this paper, the available statistical data such as periodical variations of seismicity in the weeks leading up to the main shock can be used as a tool for estimating the approximate time of a future important earthquake. The weekly variations of seismicity before Zohan earthquake indicate a relative increase and then decrease within a 100 km radius around the epicenter of the main shock.
Table 1: Variations of frequency of foreshock based magnitude before Zohan earthquake
| Week before main shock | Frequency of foreshock in the Radius of 100Km from main shock | Frequency of foreshock(with M>2.5) in the Radius of 100Km from main shock |
| 6 | 0 | 0 |
| 5 | 1 | 1 |
| 4 | 1 | 0 |
| 3 | 2 | 0 |
| 2 | 5 | 3 |
| 1 | 2 | 0 |
Studies on numerous earthquakes in Iran and other regions in the world show that the distribution of aftershocks can be related to fault type or the direction of principal stress (Saket and Fatemi Aghda, 2006) and (King et al., 1994). Whereas maximum Coulomb stress change is related to maximum principal stress in earthquakes, the concentration of aftershocks can coincide with the direction of maximum principal stress (σ1) of the causative fault in mainshock. Considering the direction of maximum principal stress and its adaptation to the scattering of aftershocks, the above hypothesis is confirmed.
Also studies on frequency changes and seismic quiescence of small aftershocks help us in predicting future aftershocks. The results the of presented research by Itawa (2008) on the World earthquake catalogue suggest that seismic quiescence theory is true for different regions of the world. Based on the results of the study mentioned above, this case can be used as a tool for predicting large aftershocks in Zohan earthquake.

Fig 1. Adaptation of direction of maximum principal stress with scatering of the aftershocks of Zohan earthquake. a: direction of maximum principal stress (σ1) of the causative fault in mainshock. b- scaterring of the aftershocks
Table 2: Seismic sequience versus magnitude of aftershocks
| Row | Seismic Quiescence for aftershocks | Aftershock Magnitude | Data and Time of aftershocks |
| 1 | 13 | 3.0 | 2012/12/05 17:21:03 |
| 2 | 36 | 3.4 | 2012/12/05 17:57:03 |
| 3 | 161 | 3.1 | 2012/12/05 20:38:09 |
| 4 | 3906 | 3.9 | 2012/12/08 13:44:19 |
Conclusion
- The results of this research suggest that we can identify some of the charactristics of the main shock by focusing on location, magnitude and depth of foeshocks.
- In Zohan earthquake, the direction of maximum principal stress is adpated to the scattering of aftershocks, and this case suggests that there is a specific relationship between them.
- The relevant analysis in this study showed that the methods such as: time series beside seismic quiescence can help conduct a more accurate time forecast of large aftershocks../files/site1/files/144/saket.pdf
Mohadeseh Sadeghi, Naser Hafezi Moghads, Mohammad Ghafoori, Mehrdad Amiri, Ali Bashari,
Volume 16, Issue 2 (Summer 2022 2022)
Volume 16, Issue 2 (Summer 2022 2022)
Abstract
The design of underground or terrestrial structures on the rock bed depends on the physical and mechanical properties. Considering the mining method in Tabas coal mine extraction method is long and destructive, the evaluation of the geomechanical properties of the rocks is more necessary. In this research, the characteristics of the rock units of the eastern tunnel No. 3 of Tabas coal Pervadeh mine were investigated. In this study, 3 samples of shale, sandstone and mudstone were examined. Considering the importance of the subject in this research, new experimental relations have been proposed, and their application shows desirable results. In order to obtain geomechanical characteristics and empirical relationships, physical tests such as porosity, water absorption percentage, unit volume weight, and mechanical properties such as uniaxial compressive strength, point load index, Brazilian tensile strength, direct cutting test, durability and brittleness index were carried out. To achieve the desired objective, the most appropriate relationships are presented using the regression method. Statistical analysis shows good correlation between different parameters in shale, sandstone and mudstone samples.
| Page 1 from 1 |
Related Websites
Site Keywords
نشریه, Academic Journal, Scientific Article, کلمه شماره یک, کلمه شماره یک, کلمه شماره یک, کلمه شماره یک, کلمه شماره دو, کلمه شماره یک, کلمه دوVote

© 2024 CC BY-NC 4.0 | Journal of Engineering Geology
Designed & Developed by : Yektaweb