
Search published articles
Showing 195 results for Type of Study: Original Research
H H.lavasani ,
Volume 10, Issue 5 (7-2016)
Volume 10, Issue 5 (7-2016)
Abstract
With regard to the increase of computing power in the past decades, finite element methods have been used to obtain the graphs of rotational moment curves which reflect non-linear effect in connections response. Several common semi-rigid connections are modeled and their behavioral properties are briefly reviewed, then the details related to a new semi-fixed connection have been provided. The behavioral properties like hardness, ultimate capacity and ductility are investigated and compared to other simulated connections. To perform non-linear analyses of connection, finite element software ABAQUS is used. In this simulation, it has been tried to have inter-component interactions according to reality as much as possible. Bolted connections are modeled exactly and the interaction among the bolt surface and hole is modeled as a hard friction with friction coefficient 0.3 with the ability of separating after loading. Also, fillet welds are modeled as a prism with triangular section. Where a groove weld is applied, since the strength in this type of welding is like base metal, two connection parts are stuck together. To mesh the element, C3D8R element is used. The proposed connection n1 has the most rigidity values among semi-rigid connections. Reducing the number of connection bolts has more reducing impact on connection rigidity value, so that with the half thickness of upper and lower sheets, rigidity rate is reduced only 9%, but with the half number of bolts, rigidity rate is reduced about 64%. Also the connection n3 have lowest rigidity rate and its rigidity amount is in the class of bolted connection in seat angle to web angle.
A Erfani , A Ghanbari , A Massumi ,
Volume 10, Issue 5 (7-2016)
Volume 10, Issue 5 (7-2016)
Abstract
Previous earthquakes have shown that topographic irregularities have significant impacts on the site seismic response and increasing structural damage by amplifying seismic responses. Studies on seismic behavior of slope topographic have shown that dynamic response of free field and soil-structure system is severely on the influence of topography shape and soil properties. Angle and height of slope, frequency of excitation, nonlinear behavior of soil and depth of bedrock are other parameters that affect on the response of the entire system. Furthermore the studies have shown that presence of structure adjacent to slope is very effective on variation of seismic behavior pattern of this topography but these studies are very limited. In this study the effect of existing structure adjacent to slope to seismic behavior pattern of slope topography have been investigated. The parameters that have studied in this article comprise slope angle and frequency content of excitation. The results show that the presence of structure adjacent to the slope, causes an increase to the response of free field and transmitting maximum response to distance away from structure position.
A Farshi Homayuon Rooz , A Hamidi , M Puorjenabi ,
Volume 10, Issue 5 (7-2016)
Volume 10, Issue 5 (7-2016)
Abstract
Consecutive impacts of pile driver hammer on a precast pile head for pile installation in the ground is called impact pile driving. Nowadays, the widespread use of impact pile driving in pile foundations construction is undeniable; As a result, pile driving is the most common source of construction vibrations among the sources of producing ground vibrations. The ground vibrations during pile driving is the most important factor of limiting the use of this method. Thus, to avoid structural damages, acceptable prediction of ground vibration before any project implementation is necessary. For this purpose, numerical modeling is undoubtedly the most accurate, economical and fastest way; but up to now, correct modeling of pile installation process has been the main problem in numerical modeling of pile driving. This study aims to achieve better match of ground vibrations with field results compared to the previous numerical results in terms of peak particle velocity by modeling impact pile driving operation through ABAQUS finite element software from ground surface to a desired depth without considering previous researchers assumptions and considering the details of practical works.
Gh Nouri , M Tahmasebi ,
Volume 10, Issue 5 (7-2016)
Volume 10, Issue 5 (7-2016)
Abstract
Due to increasing speed and mass of trains and vehicles, the errors arising from utilizing moving force method to obtain dynamic response of bridges cannot be neglected. In this paper, dynamic response of bridges under moving loads is studied. The bridge is modeled as simply-supported Euler-Bernoulli beam. Since in modeling moving loads by moving force method, inertial forces are neglected, this method is valid for a limited range of influential parameters (speed and mass). By considering inertial forces between the moving load and supporting structure, moving mass method can be utilized to extract dynamic governing equations. Numerical results reveal that by increasing speed and mass of the moving load, midpoint dynamic deflection of bridge obtained by two distinct methods differ considerably. For example, for mass ratio of 0.15 and speed ratio of 0.8, 11 percent difference is observed in midpoint dynamic deflection calculated by two aforementioned methods.
Aida Jahed Shiran, Masood Azhdarifar, Afshin Meshkat-Dini,
Volume 10, Issue 5 (7-2016)
Volume 10, Issue 5 (7-2016)
Abstract
This research is focused on an analytical approach to investigate the seismic performance of tall building under scaled near-field earthquake records. To achieve this objective, it is employs medium to high rise steel bundled-tube rigid frames. The examined structures are designed according to the Iranian seismic code 2800 (4th edition). To study the seismic response, groups of near field earthquake records with their associated properties are selected to perform non-linear time history analyses. The most important characteristic of the chosen near-field earthquake records is the presence of powerful long-term velocity pulses which distinguishes them from far-field earthquake records. The first part of the mentioned ensemble includes two recorded strong ground motions in Iran i.e. Tabas 1978 and Bam 2003, respectively and two powerful records of the Northridge 1994 earthquake. The second part contains one far-field record of the Northridge 1994 earthquake. The selected records are scaled based on the Iranian seismic code 2800 (3rd and 4th editions). The characteristics of seismic performance of each structural model, including maximum relative displacement of each story, seismic base shear and the formation of plastic hinges in the resistant skeleton have been carefully evaluated. The results indicate that using the 4th edition of the Iranian seismic code 2800 produces noticeably lower values of scale factor and their associated seismic responses in the studied structures as well as the nonlinear demand of the main load bearing members under scaled records with those factors, compared to the corresponding analytical cases based on the 3rd edition of the Iranian seismic code 2800. According to the results of this study, the rate of the drift parameter variations of structures that have been evaluated on the basis of seismic code 4th edition in comparison with the seismic code 2800 are experiencing a relative reduction about 30%.
Aliakbar Momeni, Gholamreza Khanlari, Mojtaba Heidari, Yasin Abdilor,
Volume 11, Issue 1 (8-2017)
Volume 11, Issue 1 (8-2017)
Abstract
./files/site1/files/7Extended_Abstract.pdfExtended Abstract
(Paper pages 135-156)
Introduction
Many civil structures (e.g. tunnel walls, bridge pillars, dam abutments and road foundations) are subjected to both static and dynamic loads. Cyclic loading leads to occurring fatigue phenomenon. Fatigue is the tendency of materials to break, or the process of damage accumulation, under cyclic loading. It was found that the dynamic fatigue strength can be reduced by 30-70 percent on average compared to uniaxial compression strength. Different materials show different response when they are subjected to cyclic loading. Some materials become stronger and more ductile, while others become weaker and more brittle. Although it is clear that the mechanical properties of rock under dynamic loads varied dramatically from those under static loads, the nature of dynamic failure in rock remains unclear, especially in cyclic loading condition. Fatigue behavior of rocks was rarely studied in respect to other materials such as steel and soil. The performed researches on fatigue behavior of rocks indicated that fatigue life will be decreased by increasing load amplitude in logarithmic and exponentially pattern. Also, strain softening is the dominated behavior of rocks against cyclic loading. Furthermore, some parameters such as maximum load level, confining pressures, amplitude, and loading frequency have considerable effects on fatigue behavior of rocks. However, available data on fatigue behavior remain insufficient for solving the practical tasks of predicting rock bursts and earthquakes. Obtained results are inconclusive and sometimes discordant. The aim of the current work was to assess tonalite rock fatigue behaviour under different loading conditions to describe the fatigue damage process of the granitic rock.
Material and methods
Several core samples were prepared to perform this research. The core samples were prepared with a L/D ratio of 2.5 with an average diameter of 54 mm. Before the fatigue tests, the physical and mechanical properties of the rocks were measured. Uniaxial compressive strength test (UCS) has been done on 5 core samples. The tests were performed in the load-control mode with a 1.6 kN/s loading rate. The tests were conducted to obtain the physico-mechanical parameters of the rocks in static loading condition, and provided a reference for subsequent dynamic tests. The cyclic tests were performed in both load and displacement control modes. To record axial and lateral strains during the fatigue tests, four strain gauges have been employed with arrangement of two axial and two laterals. Also, three acoustic emission sensors were installed on top, mean and bottom of the core samples to record cracking sound. In order to doing the tests a servocontrol Instron machine with 500 kN capacity was employed. The fatigue tests were conducted with three different maximum loads, 1 Hz frequency, and constant amplitude (0.82 of uniaxial compressive strength). The maximum stress level (the ratio of maximum cyclic stress to static strength) was varied 0.80, 0.85, and 0.90. The amplitude level (the ratio of amplitude stress to static strength) ranged from 0.50 to 0.70 and 0.90. Finally, Multi stages loading with increasing amplitude were applied for the displacement control tests. The results of fatigue tests have been evaluated by fatigue damage parameters including maximum and minimum axial strain, maximum and minimum lateral strain, tangent and secant modulus, toughness and hysteresis energy.
Results and discussion
The obtained results indicated that during fatigue process failure occurs below the maximum strength loading condition as a result of accumulative damage. Analysis of the fatigue test results showed that the fatigue failure consisted of three stages: fatigue crack formation (initiation phase I), stable crack propagation (uniform velocity phase II), and unstable crack propagation resulting in a sudden breakdown (accelerated phase III). By comparing the axial and lateral deformation, it was found that lateral deformation is more sensitive to fatigue. At higher stress levels, considerable part of fatigue life is response to crake development, whereas at lower stress levels, crack acceleration phase of fatigue life is distinguishable. Descending trend of loading and unloading tangent modulus shows a scatter pattern. This behavior may be related to the calculation method and loading condition, as well as microstructure and behavior of the rock mass. In spite of tangent modulus results, the three-stages of damage process (especially phase I and II) for secant modulus in both loading and unloading conditions are clear. The result is due to the method of calculation and increase in axial strain with increasing number of cycles. Brittle behavior of this type of rock leads acceleration phase to be hidden and unclear in most of fatigue damage parameters. A dramatic decrease of toughness and hysteresis energy in the first few cycles is due to the closing of pre-existing micro fractures. In fact, during the initial cycle, the rock behaves in a more ductile fashion than in the next few cycles. Thereafter, toughness begins to increase slowly, then steadily, and finally rapidly. A similar behavior was found for hysteresis energy as well. This fact indicated that cracks generated in parallel to loading direction. Fatigue displacement control tests show a strain softening behavior for the granitic rocks. This behavior is highlighted in variation of maximum stress during the tests. This parameter, especially in final step of loading, shows distinguishable decreasing trend.
Conclusion
The tonalite rocks were subjected to uniaxial cyclic loading in both load and displacement control mode. The following conclusions were drawn from this research.
-Accumulated fatigue damage occurs in an obvious three-stage process. This is the result of the micro-fracturing mechanism in the fatigue process.
-By comparing axial and lateral strain damages, it was found that crack propagation occurred in the loading direction and crack opening occurred in the lateral direction. So, among fatigue damage parameters, lateral strain shows the best three-stage fatigue damage behavior.
- Strain softening was found as rock response to cyclic displacement control loading.
Majid Taromi, Maziar Hosseini, Seyed Mahdi Pourhashemi, Majid Sadeghi,
Volume 11, Issue 1 (8-2017)
Volume 11, Issue 1 (8-2017)
Abstract
./files/site1/files/3Extended_Abstract.pdfExtended Abstract
(Paper pages 51-72)
Introduction
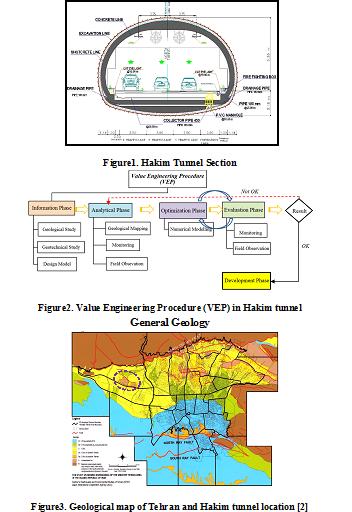
Value engineering is considered an efficient alternative to improve design and construction process of urban tunneling projects. Application of value engineering techniques can provide investigating all aspects of a project in a team work, creative and short-time manner which contribute to precisely identify a project’s quality improvement issues, construction time and costs.
Hakim Expressway one of the capital's main highways in Tehran metropolis with 9 Km in length, starts from the junction of Resalat expressway and Kurdistan expressway after Resalat tunnel and ends in Lashgari expressway. The west extended this highway passing through the area of Chitgar forest park. Due to environmental constraints, the Hakim twin tunnels with cross-section of 186 m2 excavation areas and total length of 3256 m to the NATM/SEM method in this area were excavated (Figure 1).
In preliminary design of Hakim tunnel project, on category of excavation and support system was suggested. During the tunnel’s excavation operation, the behavior and classification of the tunnel were investigated from field observation, instrumentation and monitoring of geological models and subsequently, further excavation process was modified in accordance with value engineering. The aim of using value engineering approach in this project was to reduce the costs without any decrease in quality, employer satisfaction along with minimum risk and as well as improving operational and practical aspects. Ultimately, establishment of the value engineering approach on Hakim tunneling project leads to 10% reduction in construction costs as well as relevant quality with the least challenges (Figure 2).
General Geology
The city of Tehran is founded on Quaternary alluvium, which has been geologically classified by Rieben [1]. The city is located at the foot of the Alborz mountain range, which is basically composed of Eocene pyroclastic deposits (green tuff) and other volcanic rocks. The geology and the morphology of the Tehran region is similar to that for other cities located at the foot of mountains.
Rieben (1966) divided the Tehran coarse-grained alluvia into four categories, identified as A, B, C and D, where A is the oldest and D the youngest (Figure 3).
Hakim tunnel project locates on foothills of northern Tehran, crossing the hills of Chitgar forest park. Results of field surveys indicate that alluvial deposits in tunnel track belong to C (ramps and tunnel portal) and A formations (in most parts of tunnel track).
Geotechnical characterization
Table1 summarizes soil input parameters. Two soil types were considered for the model with 8- meter-height overburden. First layer (No.1) starts from surface with a 1 meter thickness. Second layer (No. 2) has 7 meter thickness.
Table1. Summary of the geotechnical parameters
| Parameter | Unit | Layer No. 1 | Layer No. 1 |
| Internal friction angle (CU) | Deg. | 29 | 33 |
| Cohesion (CU) | Kg/cm2 | 0.15 | 0.45 |
| Density | Kg/cm3 | 18.5 | 20 |
| Poisson ratio of unloading/reloading | Kg/cm2 | 0.2 | 0.2 |
| Secant deformation modulus | Kg/cm2 | 550 | 900 |
| Power of stress level of stiffness | 0.5 | 0.5 | |
| Stiffness unloading | Kg/cm2 | 1650 | 2700 |
Detailed analysis before excavation and continuation of studies led to two excavation and support classes purposed for Hakim tunnel. Both classes of excavation and support due to ground conditions are modeled and analyzed using software Plaxis. For verification, the results of numerical analysis using monitoring and field observations were compared during the tunnel excavation. The results of monitoring compliance with the results of numerical analysis were appropriate.
Implementation and construction costs were calculated for different sections of two excavation and support classes in accordance to contraction documents to evaluate the effect of optimization in design (Figures 6, 7)
.jpg)
Figure4. Excavation sequence in excavation and support class “A”
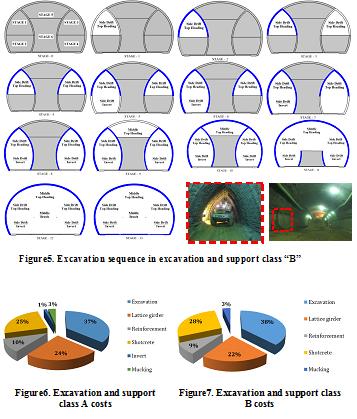
Results
Results indicate that in both classes maximum costs are related to excavation section while minimum costs are for invert and mucking. In all concrete spray operations there was just a %3.5 increase in costs. Overall savings in excavation and support was about %10 which is significant (Figure 8).

Figure8. Savings percentage comparison in excavation and support classes A and B
M Ataei, Sh. Hosseini, S.h Hoseinie,
Volume 11, Issue 1 (8-2017)
Volume 11, Issue 1 (8-2017)
Abstract
./files/site1/files/4Extended_Abstract.pdfExtended Abstract
(Paper pages 73-90)
Introduction
Up to now, various indexes and methods have been presented for evaluating the abrasivity of rocks. In total, these methods can be divided to two main groups; the methods based on nature of rocks, methods based on heuristic tools. Schimazek F-abrasivity index is one of the most powerful and applicable indexes for evaluating the rock abrasiveness. This index uses the grain size, Brazilian tensile strength and equivalent quartz content for abrasivity analysis. Since the values of these parameters are equal in Schimazek index, therefore, in some cases this index doesn't have suitable ability to distinguish and classify the rock abrasiveness. This paper tries to modify the Schimazek index considering the weights of its applied parameters.
Material and Methods
In this research, Fuzzy Delphi Analytical Hierarchy Process (FDAHP) has been used to calculate the weight of dominant parameters in rock abrasivity. For this purpose several questioners have been distributed and the expert opinions were collected. The results showed that the quartz content, grain size and tensile strength have the weight of 0.4, 0.31 and 0.29 respectively and new Schimazek F-abrasivity index is as presented in equation (1).
.jpg)
In the next stage, in order to facilitate the application of new index, a new classification system was developed. This classification and related weighing graphs (Figure 1) help to change the discontinuous classification to continuous one.
Results and discussions
In order to verify the application of the new developed index, ten ornamental stones have been studied and the old and modified Schimazek indexes were calculated for all of them. Then, the cutting rate (sawing rate) of each stone was recorded in laboratory and the mathematical relationships between new and old indexes have been achieved. The results show that the new Schimazek abrasivity index has higher ability to predict the cutting rate than old one (Figure 2).
.jpg)
Figure1. Continuous weighting for parameters of Schimazek F-abrasivity index
.jpg)
Figure2. Regression of old and new Schimazek F-abrasivity index with cutting rate of granite ornamental stones
Conclusion
Generally it could be concluded that, the main weakness of Schimazek F-abrasivity index which is the equality of parameters’ importance, has been removed by idea developed and confirmed in this study. The different weights which allocated to grain size, Brazilian tensile strength and equivalent quartz content in study, improves the Schimazek index applicability in rock engineering applications specially rock cutting and drilling. Therefore, it is recommended to use new method instead of old one in future applications.
Mohammad Hosein Ghobadi, Seyed Hosein Jalali, Bahman Saedi, Noshin Pirouzinajad,
Volume 11, Issue 1 (8-2017)
Volume 11, Issue 1 (8-2017)
Abstract
./files/site1/files/5Extended_Abstract.pdf Extended Abstract
(Paper pages 91-114)
Introduction
Due to possibility of occurrence in various natural environments and the variety of natural and artificial factors that affect landslides, landslide has special importance in natural hazards. Depending on the landform, several factors can cause or accelerate the landslide. According to previous researches, Human activities, land morphology, geological setting, slope, aspect, climate conditions, proximity to some watershed features such as rivers and faults are the most important parameters. Landslides occur frequently each year and they can cause heavy losses which compensating some of them requires a lot of money and time.
Assessing landslide related hazards with only limited background information and data is a constant challenge for engineers, geologists, planners, landowners, developers, insurance companies, and government entities.
The landslide occurrence in terms of time and place are not easily predictable, for this reason, Landslide Hazard Zonation (LHZ) or Landslide Susceptibility Zonation (LSZ) maps are used to predict the happening of landslides. A landslide susceptibility map depicts areas likely to have landslides in the future by correlating some of the principal factors that contribute to landslides with the past distribution of slope failures. These maps are basic tools for land-use planning, especially in mountain areas. Landslide susceptibility mapping relies on a rather complex knowledge of slope movements and their controlling factors. The reliability of landslide susceptibility maps mostly depends on the amount and quality of available data, the working scale and the selection of the appropriate methodology of analysis and modeling.
Such maps are obtained by dividing of a region into near-homogeneous domains and weighting them according to the degree of possible hazard of a landslide. There are two ways to do landslide hazard zonation: (i) a qualitative approach that is based on expert knowledge of the target area and portrays susceptibility zoning in descriptive terms; and, (ii) a quantitative approach based on statistical algorithms. In the present study of landslide susceptibility zonation, bivariate statistical methods (information value, density area, LNRF, frequency ratio) were used. In bivariate statistical analysis, each factor map is combined with the landslide distribution map and weighting values based on landslide densities are calculated for each parameter class.
Materials and Methods
The best method for studying landslides, which has long been of interest to researchers, is hazard zonation. In this method due to the affecting factors in landslide occurrence, the study area is classified into areas with low to very high risk. Such zonation could be of great help in regional planning. Different methods have been developed for this purpose. In this research four bivariate statistical methods namely information value, density area, LNRF, and frequency ratio are used to investigate the hazard zonation in Poshtdarband region, Kermanshah province. The study began with the preparation of a landslide inventory map. The instability factors used in this study included geology, land use, normalized difference moisture index (NDMI), slope gradient, aspect, distance from faults, distance from surface water, distance from roads, profile curvature and plan curvature. Landslide area ratio was calculated in classes of effective factors maps and weighted by four bivariate statistical methods. In addition, landslide hazard zonation maps were obtained from algebraic sum of weighted maps with regard to breakpoints of frequency curve. Finally, by using density ratio (Dr) Index through all four methods hazard classes were compared and with the help of quality sum (Qs) and precision (P) indexes these four methods were compared and evaluated.
Results and Discussion
If the landslide susceptibility analyses are performed effectively, they can help engineers, contractors, land use planners, etc. minimize landslide. In this study, bivariate statistical methods were applied to generate landslide susceptibility maps using the instability factors. The bivariate approach computes the frequency of landslides with respect to each input factor separately, and the final susceptibility map is a simple combination of all the factors irrespective of their relative significance in causing landslides in a particular region.
In table 1 subclasses of instability factors which had the highest value in different methods, are summarized.
The density ratio indexes (Dr), quality sum indices (Qs) and precision indices (P) were used to compare the methods. By overlaying the landslide inventory map of the study area and landslide hazard zonation maps, quality sum (Qs) and precision (P) indices introduce a suitable model for the studied region, and density ratio index (Dr) introduces division precision among the zones or hazard classes in each zonation model.
Table1. subclasses of instability factors in different methods which had the
highest value
| factor methods | aspect | Slope | distance from surface water | land use | plan curvature | profile curvature | distance from fault | distance from the roads | NDMI |
| information value | N, NE | >40 | >1000 | forest | concave | concave | <500 | >1000 | -0.17_ -0.408 |
| density area | N, NE | >40 | >1000 | forest | concave | concave | <500 | >1000 | -0.17_ -0.408 |
| LNRF | SW, S | 10-20 | >1000 | pasture | Convex | convex | <500 | >1000 | -0.17_ -0.408 |
| frequency ratio | N, NE | >40 | >1000 | forest | concave | concave | <500 | >1000 | -0.17_ -0.408 |
Method precision (P) values for information value, density area, frequency ratio, and LNRF methods are 0.160826, 0.241024, 0.240672 and 0.16942 respectively.
Conclusion
- Frequency ratio, density area and information value methods showed that forest land use, slope and slope shape factors have the highest impacts on a landslide occurrence.
- The LNRF method showed that geology factors, pasture land use and distance from surface water had the greatest role in landslide making.
- For frequency ratio, information value, and density area methods, the effective factors in landslide are the same, however through the LNRF method, the three factors which have the greatest impact on landslide happening, are generally different from the three other methods.
- The density ratio values show that density area and frequency ratio methods respectively have more accuracy and applicability within all used methods for separating hazard classes in the study area.
- The quality sum (Qs) results indicate that although there are minor differences, the frequency ratio compared to the density area method was more accurate and more applicable for separating landslide hazard in the Poshtdarband region.
- The calculated results of P index indicated that among the used methods, the density area method with a nuance of the frequency ratio method is the most suitable method for the study area.
, ,
Volume 11, Issue 2 (11-2017)
Volume 11, Issue 2 (11-2017)
Abstract
./files/site1/files/3.pdfExtended Abstract
(Paper pages 201-224)
Introduction
Soil nails are traditionally designed with uniform length and equal spacing to stabilize slopes which do not meet safety requirements. However, nails with uniform layout in a slope may not be the optimal design if the construction cost is taken into account. The optimal layouts lead to a minimum usage of nails and satisfies the allowable factor of safety and wall deformation.
In this study a decreasing trend of nails length along the wall height was considered to investigate the stability and the performance of the wall in different nail patterns. Then nail density was introduced as an important factor on the overall stability and deformation of the wall. It can be beneficial in the preliminary estimation of the required nail length at the beginning of a project.
Findings of this study are helpful for effective design of soil–nailed slopes.
Materials and Methods
The finite element analyses were conducted to investigate the effects of nails pattern on the overall stability and deformation of soil–nailed walls. Slope/W software was used to obtain the Factor of safety and Plaxis 2D was used to calculate the deformation of the soil nail walls. Soil hardening model was used to simulate the behavior of soil. In this study, various walls with different specifications were modeled and analyzed. As an example, a 10 m deep soil nail wall with C=10 kN/m2, ?=25 deg, Eoed=20000 kN/m2 is discussed here to monitor the trends (C represents cohesion, ? is the angle of friction and Eoed is the modulus of elasticity of the soil).
As it is shown in Figure 1, by considering the decreasing trend of nail length along the wall height, an ordered arrangement (pattern) is introduced by presenting “L” as the base nail length and “” as the inclination of stabilized zone border then, the effect of nail arrangement on the safety factor and deformation of nailed wall is investigated. The nails were installed with an angle of 15 degrees relative to the horizon. According to FHWA a minimum value of 1.35 is considered for the factor of safety. Circular failure surfaces are assumed and the tensile and pullout resistance of the nails crossing the failure surfaces are considered as the governing stabilizing forces.
Results and discussion
In this study, soil nails pattern effects on the performance and the stability of the soil nail wall are investigated. In Figure 2 variation of safety factors caused by different soil nails arrangements is illustrated. Generally three separated trends are observed in each curve. It demonstrates that at lower values of with small bond length, the factor of safety is constant. As increases the bond length behind the slip surface becomes longer and the safety factor is increases gradually. Eventually it reaches a point that the nails are long enough that increasing the nails length is not influential in the stability of the wall. Hence, nails at different elevations of a slope have different contribution to the overall stability of soil–nailed slopes.
Wall deformations need to be controlled by the allowable deformation level in designing the soil nailed wall especially when buildings or other underground facilities exist near the excavation. One of the most important parameters on soil nailed wall deformations is the arrangement of nail lengths.
Figure 3 shows the effect of nail arrangements on the wall horizontal deflection. In general, as and L increase, horizontal deflection of the wall decreases. The rate of this reduction is higher in lower base length. As it is
.jpg)
illustrated in Figure 3, by increasing the length of the nails, the deflection is decreased till no significant reduction is observed.
As it is shown the arrangement and the layout of the nails are influential on the stability and deformation of the soil nailed walls. However, it is important to identify an optimal layout in a way that with optimum nail length, allowable stability is reached and the wall deformation stay in an allowable range.
Nail density is defined as the ratio of the required nail length per the unit area of the wall surface and defined as below:
.jpg)
where Li is nail length of each row and A is the stabilization area. Hence, estimating the nail density can be beneficial for the engineers to have a preliminary estimation of the costs of the project at beginning of the project.
Figure 4 indicates that the nail density governs the wall deformation. As it is seen, for different layouts with the same nail density, the resulted deflections are so close. Hence, it can be concluded that nail density is a key factor in determination of the wall deflection. It is also illustrated that, as the nail density increases, the reduction rate of the deflection is decreased. Effective nail density is defined as a threshold point that increasing the nail density is no longer effective on deformations.
.jpg)
As it is demonstrated in Figure 5, different layouts with a similar nail density have close values of safety factors. In walls with higher nail density increasing the nail length is fruitless and at lower nail density nails are not effective.
Horizontal deflection profile
During the construction process the wall tends to move outward. Figure 6 illustrates the effect of soil nails arrangements on the deformation of a 10 m deep wall for a constant base length. As it is shown, by increasing the horizontal deflection at the top of the wall decreases in a way that at higher values, the wall deformation mode changes from overturning mode to bulging mode.
Conclusion
In this paper the effects of soil nail arrangement on the stability and performance of the wall was investigated. An ordered arrangement of the nails was introduced and the effect of various nail lengths at different elevations of the wall was discussed. Major findings concluded from this research are summarized as follows:
.jpg)
Nail density was defined as a key parameter and the findings demonstrate that nail density plays an important role in controlling the stability and the performance of the soil nail walls, in a way that patterns with the same nail densities but different arrangements, result in the almost similar factors of safety and deformations. Therefore based on the allowable factor of safety and deformation, nail density can be concluded and the nail arrangement which meets the standards, is selected.
Threshold nail density is defined as a value of nail density which no significant reduction of deflection happens afterward.
Uniform distribution of the nails and lower values of generates the maximum deflection at the top of the wall. As increases, the bond length in the upper parts of the wall controls the deformation. In that case, the deflection value is bounded and the maximum deflection occurs at the middle depth of the wall. Therefore the mode of deformation changes from overturning mode to bulging mode. As a result, in the projects which their adjacent structures are of high importance, it is recommended to use more
Eng Yasaman Salahshour, Dr Alireza Ardakani,
Volume 11, Issue 3 (1-2018)
Volume 11, Issue 3 (1-2018)
Abstract
The results of an ongoing FEM parametric study are presented regarding the dependence of the resulting piled raft behavior under lateral load and combination of loads on pile diameter, pile length, arrangement of piles and raft thickness. Taguchi method with Analysis of Variance (ANOVA) was employed to calculate the contribution ratio of these factors on the lateral displacement of piled raft. The obtained results of this study show that the pile diameter is an effective factor in horizontal deformation of the piled raft under pure horizontal load. However, in the case of load combinations, the pile length has the highest participation ratio in reducing the horizontal deformations.
Majid Mahdi, Hooshang Katebi,
Volume 11, Issue 4 (5-2018)
Volume 11, Issue 4 (5-2018)
Abstract
Introduction
Recently, several studies on buried pipelines have been conducted to determine their uplift behavior as a function of burial depth, type of soil, and degree of compaction, using mathematical, numerical and experimental modeling.
One of the geosynthetics applications is the construction of a reinforced soil foundation to increase the bearing capacity of shallow spread footings. Recently, a new reinforcement element to improve the bearing capacity of soils has been introduced and numerically studied by Hatef et al. The main idea behind the new system is adding anchors to ordinary geogrid. This system has been named as Grid-Anchor (it is not a trade name yet). In this system, a foundation that is supported by the soil reinforced with Grid-Anchor is used; the anchors are made from 10×10×10 mm cubic elements. The obtained results indicate that the Grid-Anchor system of reinforcing can increase the bearing capacity 2.74 times greater than that for ordinary geogrid and 4.43 times greater than for non-reinforced sand...../files/site1/files/0Extended_Abstract6.pdf
Sm Fatemiaghda, H Shahnazari, H Karami, M Talkhablou,
Volume 11, Issue 4 (5-2018)
Volume 11, Issue 4 (5-2018)
Abstract
Carbonate soils are different from silicate soils respect to their origination and engineering behavior. Particles of these soils are mainly residual or debris of sea animals or plants with large amount of calcium carbonate. They also may be chemical sedimentation of calcium carbonate over other soil particles in specific region of seas and oceans. The most important characteristic of these soils is the crushability of their aggregates under loading which is mainly due their shape and also small voids inside of them. Crushability and subsequent volume changes in carbonate soils have caused many engineering problems in some geotechnical structures such as ...../files/site1/files/0Extended_Abstract5.pdf
Bioavailability and Concentration of Heavy Metals in Soils and Plants near Irankuh mine Tailing Dams
Mahsa Rokhbar, A Qishlaqh, G Forghani,
Volume 11, Issue 4 (5-2018)
Volume 11, Issue 4 (5-2018)
Abstract
Introduction
Exploitation or processing of ores is usually associated with the production of a large amount of waste materials. These materials often have a high concentration of metals which can enter the environment through weathering or erosion. It is well-known that the measurement of the total concentration of metals cannot be an adequate for evaluating the pollution status of soil. Therefore, in most studies on soil contamination, bioavailability content of metals is determined by which can predicate the fate of the metals entering into the other parts of the environment such as plants, water or human food chain. The bioavailability of metals in the soil environment is the exchangeable and absorbable metals for plants, which depends on their exchangeability and absorption by soil organisms especially plants. This is also the function of the chemical form of each element in the soil. The main purpose of the present study was to measure the total concentrations along with the bioavailable content of metals in soils and plants around the Irankuh mine tailing dams.
Area of study
The Irankuh lead and zinc mine is located 20 kilometers southwest of Isfahan. This mine is of MVT type Pb-Zn deposit which occurred mainly in limestone and dolostone of lower cretaceous age. The Irankuh mine is an open-pit mine with annual extraction of 358 thousand of PbO and ZnO. The exploitation of mine is also associated with the production of a large amount of waste material which is piled in open dumps around the mine. The main minerals of ores are galena, sphalerite and pyrite.
Materials and methods
31 sampling sites were selected randomly for collecting agricultural soils around the tailing dams. Each soil sample is actually composite sample of four samples which are taken from a depth of 15 to 20 cm. Seven cultivated plants (Ocimum basilicum) were sampled from green houses in the vicinity of tailing dams. After drying and sieving, about 50g of the soils are chemically analyzed in order to determine the total concentration of the metals by the ICP-OES method. Plant samples after drying were changed to ash in the furnace at temperature > 500 C. The concentrations of metals (Zn, Pb and Cd) were then measured by Atomic Absorption Spectrometers in their stem, roots and leaves.
pH samples of soil were also determined using the EPA 9045 method. Walkley and Black method were used to measure the amount of organic matter. The cation exchange capacity (CEC) of soil samples was also determined based on EPA 9087 method. Soil texture determined using hydrometric method and then classified according to USDA classification. Diethylene Triamine Pentaacetic Acid (DTPA) extractable metals (bioavailable content) were determined using the method by Lindsay and Norvell (1978) and their concentrations in the DTPA extracts were determined by Atomic Absorption Spectrophotometer (AAS).
The metal transfer from soil to plant was calculated using the transfer factor (TF: metal content in plant divided by metal content in soil).
Results and discussion
The soil pH of the studied samples varies from 7.36 to 8.35. Cation exchange capacity (CEC) of soil samples was estimated to be in the range of 4 to 22.2 Meq/100 g. Also, the amount of organic matter in the studied soil samples varies from 0.17 to 3.43%. The relative high levels of soil organic matter are probably due to addition of organic manure to soil through agricultural activity. The total concentration of these three matls are significantly higher than their corresponding values in the crust implying that the mining activity and tailing dams greatly elevated the concentration of these metals in soils. Statistically, there is a significant positive correlation among Zn, Pb and Cd (at confidence level of 0.01) indicating that their potential source is the same or having similar geochemical behavior in the soil. The soil clay content showed a significant correlation at the level of 0.05 with Zn, Cd and Pb. This indicates that clay fraction plays a significant role in absorption of these metals in soil. According to the results of single extraction (DTPA method), the proportion of available content for Cd is higher than that of Zn and Pb. Cadmium is often characterized by its high mobility in soil media. Based on the correlation coefficients at the confidence level of 0.01, it is also observed that the increase in total concentration of Cd increased its bioavailability content in the soil consequently increase the availability of other elements in the soil. Therefore, it can be inferred that the availability of Cd in the soils of the study area is likely to be increased in the presence of Zn and Pb because in sites where the total concentration of Pb and Zn is high, the content of Cd availability has also elevated.
Based on the comparison of the average concentration of the metals in different parts of the plants, the concentration of metals is ordered as follows stem> leaf> root, which indicates the high root capacity for the accumulation of metals. The average transfer factor (TF) for Cd is obtained much higher than those of Zn and Pb. There is also a negative significantly correlation between the concentrations of Cd in the aerial parts of the plants and its bioavailability concentration in the soil. Also, there is positive and significant correlation between Zn and Cd for all three different parts and its bioavailability concentration in the soil. In the case of Pb, a significant correlation is observed between stem and root parts. This means that Cd and Zn after being absorbed by the root, are more likely being uptake by the plants due to high mobility of zinc. However due to less mobility of Pb, it is seemingly entered into the plant aerial parts after absorption by the root.
Conclusion
The concentration and degree of contamination of the studied soils is very high in terms of total Pb, Zn and Cd concentrations in agricultural soils around the Irankuh mine. The increased heavy metal contents in soils can be attributed to mining activity and tailing dams near cultivated lands. The measurement of the bioavailable content of these metals indicates that the Cd has the highest availability as compared to Zn and Pb. The average concentration of Pb and Cd in different parts of plant which is higher than the permissible limits, implying that the transfer of the available metal part (especially Cd) from the contaminated soil into the plant. Based on the calculated health risk assessment index in this study, it can generally be concluded that the gradual accumulation of these metals, especially in aerial parts of basil might have health hazards for local consumers. ./files/site1/files/0Extended_Abstract3.pdf
Nima Headarzadeh, Tania Taslimi,
Volume 11, Issue 4 (5-2018)
Volume 11, Issue 4 (5-2018)
Abstract
Introduction
One of the most important 1-ring aromatic organic pollutants is phenol and its related compounds. These compounds are classified as hazardous wastes base on U.S.EPA primary contaminates list. The phenolic compounds are very poisonous and these are harmful for human health and also for other biota.
To control the movement of such hazardous organic waste in a contaminated soil, solidification/stabilization (S/S) process can be an effective alternative. Due to the negative impact of organic compounds on the cement hydration, the cement-based S/S may be not effective for controlling the movement of such pollutants. To avoid these effects, using some additives during solidification period has been recommended. One of the proposed of such compounds is organophilic clay that is the modified montmorillonite by quaternary ammonium salts (QAS). There are several researches to evaluate the organophilic clay effect on adsorption and stabilization of organic compounds during S/S process. The effectivity of S/S process can be examined by several tests such as leaching test, durability, unconfined compressive strength (UCS), etc.
In this study, efficiency of ordinary and organophilic clay was evaluated in the solidification and stabilization process based on unconfined compressive strength of a phenol-contaminated soil.
Material and methods
In this study, an artificially phenol contaminated sand was considered to evaluate the effectivity of the white cement based S/S process by using two different additives of ordinary and organophilic clay.
The contaminated sand contains 2000 ppm of phenol. S/S process was conducted on 14 samples with different amounts of white cement (15 and 30 wt%) as binder and ordinary/organophilic clay (0, 8, 15, and 30 wt % for each of them) as the additives. Two zero percent additive samples are considered as control samples.
All samples were cured for 28 days and then UCS test was conducted for all of them.
Results and discussion
Unconfined compressive strength of all examined samples were ranged from 2226 to 6999 KPa. In the samples with equal amount of cement, th higher UCS values can be observed in blank samples (without any additives and phenol). By adding phenol in the examined sand, UCS of the solidified sample reduces 3 -3.5%.Moreover, results showed that UCS was reduced by increasing the amount of clays. The reduction of the samples containing organophilic clay was higher than samples containing ordinary clay. Unconfined compressive strength values of all samples met the minimum standards indicated by France, Netherlands, Britain and America for disposal in a sanitary landfill. The sample with 30% white cement and 8% bentonite was the maximum amount of UCS (4856 KPa) and the sample with 15% white cement and 30% organophilic clay was the minimum one (2226 KPa). In this study, the average cost of organophilic clay-based solidified samples was 2.3 to 2.8 times more than the average cost of the bentonite-based solidified samples.
Conclusion
In this study, the strength of the cement-based solidified samples contaminated by phenol was investigated. The summary of the findings of the research is as follows:
1. By adding the phenol to pure sand, the UCS of the samples can be reduced 3-3.5 %.
2. Addition of organophilic clay reduces the UCS of the samples more than the ordinary clay (bentonite) in the same amount.
3. All samples met the recommended UCS level for the S/S process. The minimum UCS level is for the sample with 15% of cement and 30% of organophilic clay.
The cost of S/S process is between 23 and 650 $/ton of contaminated soil depending on the amount of used additives and binder. The samples containing organophilic clay has a higher cost than the similar sample containing ordinary clay.
4. To evaluate the S/S process effectivity, a leaching test of phenol (such as TCLP) is recommended ./files/site1/files/0Extended_Abstract2.pdf
Ali Reza Najibi, Mohammad Ghafoori, Gholam Reza Lashkaripour, Mohammad Reza Asef,
Volume 11, Issue 4 (5-2018)
Volume 11, Issue 4 (5-2018)
Abstract
Introduction
Determination of in situ stress-direction and magnitude are prerequisite for any oil well drilling and oil field development such as hydraulic fracturing. One of the simplest and most widely used methods is called borehole breakout analysis. Breakouts are compression fractures made in the direction of minimum horizontal in situ stress (Sh), if drilling mud pressure be lower than optimum mud pressure. Some borehole imaging logs such as FMI, FMS and UBI are appropriate tools for wellbore fracture detection. These fractures are distinguished in the logs as dark and symmetrical points (or lines) on both sides of the well and are used as an indicator for in situ stress studies. The size and shape of these fractures are strongly depend on the magnitude of the in situ stress. Therefore, many researchers suggested that by analyzing the geometric shape of the borehole breakout is an appropriate technique for estimation of in situ stress components. .... ./files/site1/files/0Extended_Abstract7.pdf
, , , ,
Volume 12, Issue 1 (8-2018)
Volume 12, Issue 1 (8-2018)
Abstract
IExtended Abstract
Introduction
The Iranian plateau is situated in the Alpine-Himalayan orogeny between the Eurasian plate in the north and the Arabian plate in the south. It is being shortened by the northward movement of the Arabian plate, which causes the most parts of Iran to be active and dynamic in terms of tectonic movements. The recent tectonic activity in the southern edge of central Alborz causes both development and deformation of the tectonically active landforms. Seismic records indicate a high frequency of earthquakes of relatively small magnitude (<4) and infrequent large earthquakes (>5.1) in the Alborz. The studied area is located in the southern central Alborz and at the edge of northwestern central Iran between seismic faults of Ipak (with approximately E-W trend) and Avaj (with NW-SE trend) that includes significant earthquakes. Generally, the dominant tectonic structures of the study area involve thrust faults. The Ipak fault is one of the major fault systems in the area, located about 120 km west of Tehran, and caused the 1962 Buin Zahra earthquake of Ms 7.2 (Mw 7.0). The earthquake was associated with 95 km surface rupture along the Ipak reverse fault with average throw of 140 cm and left-lateral displacement of 60 cm. This investigation has evaluated the active tectonics and the acceleration zoning of the region in order to analyze and measure the recent tectonic activities.
Material and methods
To assess the acceleration zoning of this region, seismic data, Kijko software, PSHA software and reduction equations were used; consequently, minimum and maximum acceleration for useful life of 75-year and 475-year building were estimated. In order to assess the relative tectonic activity through the study area, sub-basins and stream network were extracted by using Arc Hydro Tools software based on the DEM and in turn, 134 sub-basins have been resulted. The six geomorphologic indices were used as follow: Stream length–gradient index (SL), mountain front Sinuosity (Smf), Ratio of valley floor width to valley height (Vf), Asymmetric factor (Af), Hypsometric integral (Hi) and drainage Basin shape (Bs). Eventually, after calculating the relative tectonic activity index (Iat), the studied area was classified into four tectonic activity classes in ArcGIS10.1 as very high, high, medium and low.
Stream Length–Gradient Index (SL): The SL index indicates an equation between erosive processing as streams and rivers flow and active tectonics. The SL is defined by Eq. (1)
SL= (∆H/∆Lr) Lsc (1)
where ΔH is change in altitude, ΔLr is the length of a reach, and Lsc is the horizontal length from the watershed divide to midpoint of the reach. The SL index can be used to evaluate relative tectonic activity. The quantities of the SL index were computed along the streams for all sub-basins.
Index of Mountain Front Sinuosity (Smf): Index of mountain front sinuosity is defined by Equation (2).
Smf = Lmf ⁄ Ls (2)
where Lmf is the length of the mountain front along the foot of the mountain in which a change in slope from the mountain to the piedmont occurs; and Ls is the straight line length of the mountain front. Smf represents a balance between erosive processes tending to erode a mountain front, making it more sinuous through streams that cut laterally and into the front and active vertical tectonics that tends to produce straight mountain fronts, often coincidental with active faults or folds.
Ratio of Valley Floor Width to Valley Height (Vf): Vf is defined as the ratio of the width of the valley floor to its average height and is computed by Equation (3).
Vf = Vfw/ [(Ald-Asc) + (Ard-Asc) /2)] (3)
where Vfw is the width of the valley floor, and Ald, Ard, and Asc are the altitudes of the left and right divides (looking downstream) and the stream channel, respectively. A significant relationship exists between the rate of mountain front activity and the Vf index. Consequently, the high Vf values conform to low uplift rates (Keller and Pinter 2002). The shape of a valley can also represent the Vf amount and uplift rate. Therefore, U-shaped valleys accommodate low Vf and high uplift.
Asymmetric Factor (Af): The asymmetric factor (Af) is a way to evaluate the existence of tectonic tilting at the scale of a drainage basin. The method may be applied over a relatively large area. Af is defined by Equation (4).
Af= 100(Ar/At) (4)
where Ar is the area of the basin to the right (facing downstream) of the trunk stream and At is the total area of the drainage basin. If the value of this factor is close to 50, the basin has a stable condition with little or tilting; while values above or below 50 may result from basin tilting, resulting from tectonic activity or other geological conditions such as lithological structure.
Hypsometric integral (Hi): The hypsometric integral is an index that describes the distribution of the elevation of a given area or a landscape. The Hi is independent of basin area. This index is defined as the area below the hypsometric curve and thus expresses the volume of a basin that has not been eroded. A simple equation that may be used to calculate the index is defined by Equation (5).
Hi = (average elevation - min. elev.) / (max. elev. - min. elev.) (5)
Then Hi values were grouped into three classes with respect to the convexity or concavity of the hypsometric curve: Class 1 with convex hypsometric curves (Hi≥0.5); Class 3 with concave hypsometric curves (Hi<0.4); and Class 2 with concave–convex hypsometric curves (0.4≤Hi<0.5).
Index of Drainage Basin Shape (Bs): Horizontal projection of basin shape may be described by the elongation ratio, Bs, expressed by Eqation (6):
Bs = Bl/Bw (6)
where Bl is the length of the basin measured from the headwaters to the mouth, and Bw is the width of the basin measured at its widest point. High values of Bs are associated with elongated basins, generally related to relatively higher tectonic activity. Low values of Bs indicate a more circular-shaped basin, generally associated with low tectonic activity.
Evaluation of Relative Tectonic Activity (Iat): The average of the six measured geomorphic indices (Iat) was used to evaluate the distribution of relative tectonic activity in the study area. The values of the index were divided into four classes to define the degree of active tectonics.
Results and discussions
Results of probabilistic seismic hazard analysis have shown that the minimum and the maximum acceleration for useful life of 75-year building is estimated as 0.33g and 0.45g and for 475-year one are 0.46g and 0.60g, respectively. These values are indicative of high risk in the studied area. Acquired values from geomorphologic indices and also acceleration zoning of the realm are indicative of high recent tectonic activities near Ipak, Hasanabad, Soltaniyeh and Avaj faults; they are extremely concordant with the obtained evidences and geomorphologic characteristics of the field samples. In this study, considering the diversity of the morphotectonic features, six morphometric indices relevant to the river channels, drainage basins, and mountain fronts were computed for every catchment, and consequently, a single index (Iat) was calculated from
The values of Af show widespread drainage basin asymmetry related to tectonic tilting, particularly associated with Ipak fault. The values of Smf suggest that mountain fronts are tectonically active, and the values of Vf show that some valleys are narrow and deep, suggesting a high rate of incision. The parts with class 1 and 2 of the relative tectonic activity are located along the main faults of the region, such as Soltaniyeh, Avaj, Hasanabad and Ipak faults and show high correlation with observed landforms during the field investigations such as the direct mountain fronts, fault gorges, fault scarps, and deep v-shaped valleys. Besides, the high amount of the relative active tectonic index shows a good consistency with the recent tectonic activity, namely tilting and deformation of the Quaternary units, which is the indicative of the effect of compressive stresses, affecting the region.
Conclusion
In this study, according to the current tectonic activity using the Iat index, it was found that the study region represents a high current tectonic activity along the fault zones. The values of SL, Hi, and Bs were found to be high along Soltaniyeh, Avaj, Hasanabad and Ipak faults segments.
According to the earthquakes and probabilistic seismic hazard analysis in the study area, it
Hamed Rajabzade, Hamid Mehrnahad,
Volume 12, Issue 1 (8-2018)
Volume 12, Issue 1 (8-2018)
Abstract
Introduction
The effect of surface geology on seismic movement is known and acceptable and this effects can consider important factor in movement resulting from earthquake. studying intensity and dispersal of recent decade earthquake destruction indicated importance of construction effects and surface geology conditions more than ever. From view point of engineering, earthquake importance is in light of effects that these earthquakes is created in construct such as dams, powerhouses, bridges, residential areas and industrial installations that in most cases, this constructs are building not only on rack mass surface but on earth surface, e.g . alluvial layers placed on bed stone. The effect of soil layers on earthquake waves is result of complex processes that this effect can exist as dynamic support under stability soil conditions that is called as intensification from it.
Material and methods
There are multiple methods in order to determining effect of construct and affecting in on earth potent movement features, that among them are covered less-cost numeral methods and more site output and beacuse of reason are using from these methods in order to analyzing respond to earthquake vibrations. In this paper try to using data resulting from drining 5 boreholes on Tabas city construction are studying the effect of and also comparing numeral methods of analyzing building such as equivalent linear and non-linear analysis for earthquake return periods of 75, 475, 2475 using NERA and EERA softwares.
Results
Taken together reinforcement rate and also maximum velocity in earth surface can explain that Dehshak region and Tabas center areas include more intensification conditions. On the other hand, south zone of Sarasyab sector and then Imamzade area include higher solidity and least intensification. Based on done studies are suggested to guided urban development programm more toward Hossein – ebne - Mousakazem Emamzadeh in order to exert from more suitable buildings. Also, regarding to EERA high-leval evalution and non-linear soil bahavior for earthquake with 2475 high return period is used from NERA software for analyzing construction effect to obtain maxium more realistic surface velocity ../files/site1/files/121/Rajabzadehi_Abstract(1).pdf
Latif Samadi,
Volume 12, Issue 1 (8-2018)
Volume 12, Issue 1 (8-2018)
Abstract
Extended Abstract
Summary
In this research seismic, electrical sounding and geoelectrical tomography methods are used to assess the distribution of strength of foundations, the earth's natural period (T0), layering conditions and petrophysical characteristics of the underlying soil. The bridge is built on alluvial sediments of the Haraz river in Mazandaran province. The bridge consists of two lateral and three intermediate bases. The Haraz river passes through the eastern and adjacent intermediate base. This research indicates that: 1- based on seismic studies, the average shear wave velocity to a depth of 30 meters at the eastern base of the bridge is significantly more than that of the western base. Therefore, the stiffness and loading capability in both bases of the bridge are different, 2- geoelectrical sounding shows that the eastern side of the bridge, most likely composed of silt and clay and there is a possibility of subsidence at the east side of the bridge, 3- electrical resistivity tomography maps in E-W section is asymmetric and shows lateral changes of soil structures along bridge. In other words, distribution of stress on eastern and middle basis of the bridge with considering mentioned reasons is stirred with probably subsidence in the last few decades utilization and appearing of defects in the body of the bridge.
Introduction
Many factors such as floods, earthquakes, hurricanes, tsunamis, improper exploitation conditions and other factors have threatened historic buildings and urban infrastructure. Iran is one of the active seismic areas of the world and unfortunately many of the historical monuments have been damaged or completely destroyed during different earthquakes. Bam citadel, the largest mud structure in the world, is an example of a cultural heritage which was completely destroyed in deadly earthquake of January 2003. In many large cities of the world such as Tehran, more than hundred bridges have been constructed to solve the traffic jam. Insecure and improper utilization may threat the strength of bridges and decrease their longevity. Today, the soil behavior under loading cycles and dynamic condition is very important in urban active seismic areas. In most cases the physical properties of soil are obtained by laboratory tests and in situ methods including refraction seismic method, reflection seismic method, SASW method, well logging, cross-hole and also geo-electrical and other geophysical methods. The relation between seismic wave velocities and stress in soils and mineral materials are to the interest of seismologist and seismic specialists. Today in exploration seismic the relation between stress and velocity of seismic waves can be used in AVO analysis and also to predicting and monitoring the hydrocarbon and thermal fields of reservoirs in 4D exploration seismic. There are many researches in this subject and established some experimental relationships between stress and elastic modulus of rocks with wave velocities. The aim of this research was to identify the seismic characteristics and geological conditions of soil beneath foundations of bridge in north of Iran mainly for investigating possibilities for strengthening the city historical oldest bridge. In this study we used simultaneously refraction seismic, electrical sounding and geoelectrical tomography methods. Seismic method used to estimate the stiffness of soil, average shear wave velocity of upper 30 m and determination of site classes. Electrical sounding and geoelectrical tomography have used to identify subsurface geology, differentiation and identifying electrical resistivity of soil profile and distribution of electrical resistivity in tomography section for understanding distribution of stress in soil. The bridge is built on alluvial sediments of the Haraz River. Mazandaran-Khazar fault is located 7 km south of study area in east-west direction. The bridge consists of two lateral and three intermediate bases. The Haraz River passes through the eastern and adjacent intermediate base.
Field surveying
Several seismic profiles surveyed in this are and five of them used in current research. Linear array are employed with P-wave and S-wave. Distance between geophones is 2 m respectively. The lengths of profiles were different due to space constrains. Length of profiles considering offsets was up to 86 m. Impulse impact is transmitted to the soil by sledge hammer equipped with a trigger element. For P- wave profiles, vertical hit on steel plate and for S-eave profiles, horizontal hit on special I-beam steel were used. In order to improve the signal to noise ratio (S/N), an average of ten hammer blows were stacked for each record. Length of records is one second with sampling interval one millisecond. The first arrival times of refraction seismic data were interpreted with considering characteristic of first arrivals in layered condition and continuous medium. The results of average shear wave velocities to the depth of 30 m in the five profiles (S1 to S5) were 774 m/s, 629 m/s, 540 m/s, 581m/s, and 563 m/s consequently.
The average shear wave velocity in the upper 30 m was globally adopted after the National Earthquake Hazard Reduction Program (NEHPR) classification in the USA. Profile S1 is located near the western base of the bridge, profile S3 near the eastern base of the bridge, profiles S2 and S6 at the middle of bridge and profile S5 about 200 m of eastern base. The average sheer wave velocity in the upper 30 m of soil in western base (Vs30=774) is more than eastern base (Vs30=540). According to the average shear wave velocities, the type of underlying soil in western base falls to B class (760<
Vertical electrical sounding is another geophysical method that used to separate the layers, thicknesses and electrical resistivities of underlying sediments at the eastern base of the bridge. The resistivity measurements carried out by injecting electrical current into the ground through the two current electrodes, and measuring the resulting voltage difference at two potential electrodes. We used symmetrical four electrode schlumberger array. The type of experimental sounding curve is AH. It means that soil profile under the eastern base of the bridge consists of 4 layers with interbedded low resistivity layer. Interpretation of geoelectrical curve shows that the first layer has a thickness of 4 m with resistivity of 800 ohm-m. Surface evidence indicates that this layer is composition of sand, gravel and conglomerate. The second layer has a thickness of 16 m with the resistivity of 334 ohm-m. This layer most probably is composition of saturated sand and conglomerate. The third layer has a thickness of 14 m with resistivity of 43 ohm-m. Low electrical resistivity shows that the grain size is fine and matches with silt and clay. The last layer as a basement starts from the depth of 34 m with electrical resistivity of more than 1000 ohm-m.
Geoelectrical tomography is another method that used to determine the lateral changes of electrical resistivity and identifying the pattern of distribution of stress in underlying soil at the middle of the bridge. Geoelectrical tomography profiles were in east-west direction. The distance between measuring points was 1 m. Electrical resistivity of sedimentary rocks and soils generally depends on porosity, mineral type, depth, stress, moisture content, structure and texture and temperature. Variation of electrical resistivity verses depth shows that the distribution of electrical resistivity of the subsurface material is not uniform and increase with depth. It also shows that the distribution of electrical resistivity in soil under the base is asymmetric in E-W direction.
Conclusions and result
Integrated geophysical studies were conducted in three stages with three different methods. The following conclusions are extracted based on study: According to seismic data the average shear wave velocity at the western side of the bridge (
Ata Shakeri, Fahimeh Yousefi,
Volume 12, Issue 1 (8-2018)
Volume 12, Issue 1 (8-2018)
Abstract
Extended Abstract
Introduction
The presence of potentially toxic elements in the environment and especially in soil has been one of the greatest concerns due to their health implications. Potentially toxic elements from anthropogenic sources tend to be more mobile than those from lithogenic or pedogenic sources. Generally, the distribution of potentially toxic elements is influenced by the nature of parent materials, climatic conditions, and their relative mobility depending on soil parameters, such as mineralogy, texture and class of soil. In the inhabited, and industrial areas, vicinity to the un-engineered landfills, excess accumulation of toxic elements in surface soils can directly threaten wellbeing of exposed inhabitants via ingestion, inhalation and dermal contact routes. A few studies conducted on risk assessment of potentially toxic elements in soils of Kermanshah province, west of Iran. Soil in the study area is susceptible to contamination by anthropogenic activities in the form of industrial wastewater, agricultural activities, solid waste, runoff, atmospheric deposition and especially un-engineered landfills. The presence of toxic elements in soil around of un-engineered landfills without proper consideration to the environmental protection measures, will certainly lead to a significant environmental hazard in Kermanshah province. Therefore, the main purposes of this study are to evaluate the contamination levels, health risk assessment, and source identification of As, Cd, Cr, Cu, Ni, Pb and Zn in the Gasre Shirin, Gilane Gharb, Paveh, Javanrood, Eslamshahr, Ravansar, Kermanshah and Sanghar un-engineered landfills.
Material and methods
A total of 30 topsoil samples were collected (0-20 cm depth) from the eight un-engineered landfills of the Kermanshah province. In order to achieve a representative sample, composite samples were prepared by mixing the four subsamples taken at each corners of 2×2 m square cell because composite sampling yields homogenized samples for analyses. The subsamples were mixed and a final sample of 1 kg was taken by repeated coning and quartering. To determine background concentration of heavy metals, eight soil samples were collected from areas far from known sources of contamination (40-60 cm depth).
The collected samples were immediately stored in polyethylene bags and air-dried in the laboratory at room temperature. Then, samples passed through a 2mm stainless steel sieve. The <2mm fraction was ground in an agate mortar and pestle and passed through a 63 micron sieve. In order to determine the concentration of As, Cd, Cr, Cu, Ni, Pb and Zn complete dissolution of soil samples (approximately 1 g of each) was carried out using a mixture of HF, HNO3, HClO4 and H2O2 in a Teflon beaker on sand bath at atmospheric pressure. The concentrations of the selected elements were measured by an accredited commercial laboratory (Zar Azma Laboratory, Iran) using ICP-MS methods. Data quality was ensured through the use of internal duplicates, blanks, and HRM. The precision and accuracy of measurements are 95% and +/-5% respectively.
The assessment of soil contamination was carried out using geochemical indices including contamination factor (CF), modified degree of contamination (mCd) and enrichment factor (EF). The methodology used for the health risk assessment was based on the guidelines and Exposure Factors Handbook of US Environmental Protection Agency. The average daily doses (ADDs) of heavy metals received through ingestion, inhalation, and dermal contact for both adults and children were calculated. In this study, hazard quotient (HQ), hazard index (HI) and carcinogenic risk (RI) methods were used to estimate non-carcinogenic and carcinogenic effects of heavy metals. The HQ was calculated by subdividing ADD of a heavy metal to its reference dose (RfD) for the same exposure pathway(s). If the ADD exceeds the RfD, HQ>1, it is likely that there will be adverse health effects, whereas if the ADD is less than the RfD, HQ<1, it is considered that there will be no adverse health effects. A hazard index (HI), the sum of HQs, which means the total risk of non- carcinogenic element via three exposure pathways for single element of <1 indicates no adverse health effects, while HI values >1 show possible adverse health effects. Carcinogenic risk is regarded as the probability of an individual developing any type of cancer in the whole life time due to exposure to carcinogenic hazards and was calculated for As and Cd as follows:
The value of SF represents the probability of developing cancer per unit exposure level of mg/kg day. The acceptable risk range for carcinogens is set to 10-6 to by the USEPA, so that RI values below 10-6 do not require further action, while risks greater than 10-4 are considered to be of concern and require additional action to reduce the exposure and resulting risk.
Results and discussion
The soil pH ranges from 7.01 to 8.06, with an average value of 7.51 suggesting neutral conditions. Organic carbon (OC) contents of soil samples ranged from 0.06% to 4.91% (average 1.59%). In this study, based on the USDA textural triangle the main soil textures are loamy, clay loam and sandy loam, respectively.
The average abundance order of selected elements content is: Zn>Ni>Pb>Cr>Cu>As>Cd. Comparison of mean concentration of the potentially toxic elements in the soil samples with mean worldwide values reveals higher Zn, Pb and Ni contents in this area.
The results of contamination factor indicate very high contamination for Cd, Cu, Pb and Zn. Modified Degree of Contamination (mCd) calculated based on background values proves very high degrees of contamination for selected trace elements in Gasre Shirin and Eslamshahr landfills soil samples The results of enrichment factor evaluation similarity to contamination factor indicate that Cd, Cr, Pb, Cu and Zn have more influence from anthropogenic sources. The maximum EF of Pb, Zn and Cd and Cu is 346.7,124 and 51.9 respectively, which means very high enrichment in Ghasre Shirin landfill soil samples.
Exposure doses of 7 heavy metals in soil samples of un-enggenerd landfills for children and adults were calculated. The total exposure HQs calculated based on adults from ingestion, dermal contact, and inhalation for Cd, Cu, Ni, Zn, As and Pb was less than 1(except Ghasreshirin landfill). The hazard quotient values based on the adult risk for Cr were greater than 1.0. The results show that HQ for Pb and As in children by dermal and ingestion pathway is exceeded 1.0 in soil samples of Paveh, Javanrood, Ravansar, Kermanshah and Sangher landfills and Ghasreshirin and Eslamshahr landfills, respectively.
Conclusion
The concentration, pollution level, potential sources and health risk of potentially toxic elements in eight landfills top soil of Kermanshah province were investigated in this study. The following conclusions were drawn from this research.
- Compared with the background values of As, Cd, Cr, Cu, Ni, Pb and Zn in soils of Kermanshah Province, landfills soil have elevated metal concentrations as a whole.
- According to high contamination level and health risk of some studied potentially toxic elements, and also due to the proximity of contamination sources to residential district of the study area, more attention should be paid to manage and reduce contamination.
- These results provide basic information of toxic elements pollution control and environment management in the area../files/site1/files/121/Shakerii_Abstract.pdf
Related Websites
Site Keywords
نشریه, Academic Journal, Scientific Article, کلمه شماره یک, کلمه شماره یک, کلمه شماره یک, کلمه شماره یک, کلمه شماره دو, کلمه شماره یک, کلمه دوVote

© 2024 CC BY-NC 4.0 | Journal of Engineering Geology
Designed & Developed by : Yektaweb