
Search published articles
Showing 144 results for gh
Nastaran Ehsani , Mohammad Reza Ghayamghamian, Mohsen Fazlavi , Ebrahim Haghshenas,
Volume 11, Issue 1 (Vol. 11, No. 1 Spring 2017 2017)
Volume 11, Issue 1 (Vol. 11, No. 1 Spring 2017 2017)
Abstract
./files/site1/files/1Extended_Abstract.pdfExtended Abstract
(Paper pages1-28)
Introduction
The earthquake is one of the most devastating natural disasters that always threats human societies in terms of health and financial issues. Iran is one of the most seismic prone countries of the world due to locating on Alpine- Himalayan Orogenic belt. On the other hand, growing population and increased construction of tall buildings, increases the damages caused by large earthquakes, especially in large cities. Karaj is one of the most populous cities in Iran which there has been considerable industrial and economic development in recent years. When an earthquake occurs, seismic waves radiate away from source and travel rapidly through the earth crust. When these waves reach the ground surface, they produce shaking that may last from several seconds to a few minutes. During earthquakes, different alluviums with different structures show various reactions. It is well-accepted that, besides the earthquake magnitude and fault distance, local geologic conditions, known as site effects, can also exert significant influences on characteristics of the seismic waves such as amplitude, frequency content and duration of strong ground motion at a given location. The seismic ground motion at any site is influenced by the type of soil in that region. Younger and softer soils usually amplify ground motion more than older soils or bedrocks .
There are theoretical and experimental methods to evaluate the site response. In the present study, the Nakamura's H/V spectral ratio method has been used to evaluate the resonance frequency in 37 locations at Karaj site. In addition, a preliminary 1-D site response modelling has been conducted using Deepsoil program according to downhole, array and geology data. Site frequencies obtained from modelling are presented and compared with site frequencies obtained through microtremor measurements.
Materials and Methods
Single station microtremor measurements at the Karaj site were carried out by the International Institute of Earthquake Engineering and Seismology (IIEES) in 2012 with a three-component broadband seismometer (Guralp CMG-6TD). In the present study, we have used 37 microtremor data along the north-southwest profile because at this profile, geological section was available and these stations contained geotechnical boreholes data. Dynamic range of sensor changes between 0.033 -50 Hz and has a natural period of 1 second. 24-bit analog-to-digital (A/D) converter digitized the recorded data. The recording system was operated continuously for about 30 minutes with sampling frequency of 100 Hz. The use of ambient vibrations for analysis of the local site effects has been studied in detail in the framework of the European research project SESAME (Site Effects Assessment Using Ambient Excitations). The recommended guidelines on the H/V spectral ratio technique are the result of the comprehensive and detailed analysis performed by the SESAME participants during three years of investigations (2001-2004).
H/V spectral ratio was carried out by the Geopsy software. The process starts by converting data from binary format to ASCII format. After DC offset removal, eighth order Butterworth band pass filter used within the range of 0.1 Hz to 50 Hz. The Anti-triggering algorithm STA/LTA has been selected to reject energetic transients from ambient vibration recordings, so STA and LTA were considered respectively 1 and 30 second. Minimum and maximum STA/LTA thresholds were selected between 0.2 and 2.5. For each station, the time-series of the record is divided into windows of 40 to 100 seconds in three components with an overlap of 50%. Also, a cosine taper with the length of 5% of the total window length was used at each end.
The amplitude spectra of each selected window is computed with a fast Fourier transform (FFT) and smoothed using the Konno-Ohmachi function (Bandwidth=40). Then, two horizontal components are merged by squared average. Finally, the H/V spectral ratio of Nakamura is applied for each individual window, and the final predominant frequency is obtained by averaging the H/V spectral ratio of all window. The presence of clear peak on H/V spectral ratio curve is indicative of the impedance contrast between the uppermost surface soil and the underlying hard rock, where large peak values are generally associated with sharp velocity contrasts, and is likely to amplify the ground motion. The H/V spectral ratio in some stations shows a clear peak and at the others might show two or multiple peaks which represents the geologically complex areas. Calculated dominant frequency changes between 0.4 and 2 Hz. These low values indicate the existence of basement at greater depths and large thickness of sediments on basement (Parolai et al., 2002).
Site modelling
The results of H/V spectral ratio are affected by the local geologic structure. Based on this assumption, we can produce theoretical H/V curve with knowledge of the geologic structure in the area. One-dimensional modelling is a suitable method to evaluation of the site response due to the local geology which requires geotechnical and geophysical data. In the one-dimensional modelling, it is assumed that all boundaries are horizontal in the infinite media and the response of a soil deposit is predominantly caused by SH-wave propagating vertically from the underlying bedrock. In this present study, one-dimensional modelling was carried out using Deepsoil software. Due to the very small deformations in soils by microtremor and producing a low levels of strain, we applied the linear method to evaluate the ground seismic response during mild earthquake shakes. In this software, homogeneous and isotropic soil profile is considered as N horizontal layers. The site response (transfer function) is evaluated by parameters such as layer thickness (m), density (ρ), shear modulus (G), and damping factor of layers (β), which are obtained from available geotechnical boreholes.
Usually, engineering bedrock is considered for the purpose of numerical modelling. According to TC4 (1994), the seismic bedrock was defined as a layer with a shear wave velocity of more than 600 m/s. Shima (1978) recommended that the upper crust with a shear wave velocity of about 3000 m/s, is adopted as bedrock when large scale structures with longer vibration period are being considered. International building code (ICC2000) has defined the seismic bedrock by a shear wave velocity of more than 760 m/s. According to Unified Building Code (UBC97), bedrock is defined into two groups: A (very hard rock with a speed of more than 1500 m/s) and B (rock with a speed of 760 to 1500 m/s). Therefore, the proposed values of the shear wave velocity are different for considering seismic bedrock. In order to consider the uncertainty of the shear wave velocity in the present one-dimensional modelling, three scenarios for the bedrock, were performed with three speeds of 760 m/s (based on engineering bedrock), 1300 m/s (bedrock geology), and 2500 m/s (corresponding to tuff-andesite of the Karaj basement) at different depths, according to the regional geological map. Then, three scenarios of the numerical modelling were compared with microtremor transfer function.
1. One-dimensional modelling at the Karaj site using downhole data for engineering bedrock (> 760 m/s)
In order to access the shear wave velocity profile for 1-D modelling, downhole data from 21 boreholes were used in nine sites which were available up to the maximum depth of 50 meters at 20 boreholes and 96 meters at A09 borehole. Low thickness of alluvium (about 17-85 meters) was considered with engineering bedrock (>760 m/s) for numerical modelling. The results represent higher frequency range compared with the microtremor data. In some previous studies where engineering bedrock had been defined by shear wave velocity values between 700 to 800 m/s in 1-D modelling, the results of the theoretical model is incompatible with experimental results. Thus, it seems that it is not suitable to consider the engineering bedrock in 1-D modelling.
2. One-dimensional modelling at Karaj site using microtremor array data for geology bedrock (> 1300 m/s)
By considering the seismic bedrock (>760 m/s) at depths of 17 to 85 meters and calculating the one-dimensional transfer function, the peaks in higher frequency compared with the experimental method is observed. According to reliability of experimental H/V results which has been proved by researchers around the world (Haghshenas et al., 2008), the difference between the transfer function results in experimental and theoretical methods indicates that two variables of shear wave velocity or depth of bedrock and alluvium thickness have not been properly modeled. It seems that in order to get better results, it’s necessary to analysis by considering the geology bedrock at greater depth. Tchalenko, et al., (1974) considered lower part of Plio-Quaternary sediments of Hezardareh Formation and Miocene marl-limestone of Upper Red Formation as the bedrock in the Karaj plain. Shafiee and Azadi (2006) computed shear wave velocity characteristics of these geological units throughout Tehran city. Therefore, a mean velocity of 1300 m/s was considered for the geology bedrock during the modelling.
In order to access the shear wave velocity profiles at greater depths, microtremor array stations were designed by seven seismometer with 100 m radius at A09 (site 8) borehole. As it can bee seen, a clear contrast at a depth of about 230 m is observed. Therefore, the modelling was carried out by taking 230 m alluvial thickness on geology bedrock according to lithology of the region. The result of this modelling has shown a peak at frequency range of 0.87 Hz that is compatible with the microtremor peaks at this site. In other site this modelling was performed using array and downhole data. The results indicated that the first effective contrast occurs at depth of 200 to 300 meters.
3. One-dimensional modelling at the Karaj site for basement (> 2500 m/s)
Transfer functions obtained from the previous model, did not cover low frequency peaks in the experimental methods. Therefore, the presence of other low-frequency peaks is either due to the geometry of the sedimentary basin or deep contrast. It seems that due to the geology of the region, tuff- andesite of the Karaj Formation as basement plays an important role in the creation of low-frequency peaks. Therefore, to obtain a better model, deep contrast was considered about 2 kilometers due to differences in the type of bedrock with a shear wave velocity of 2500 m/s. For this purpose, according to the properties of the Upper Red Formation, an average constant speed of 1400 (m/s) was considered in modelling and by changing the thickness of this layer, the modelling was continued in a trial and error manner until the numerical model is consistent with microtremor peaks. The modelling results in nine site indicate that there is basement at the depth of 2000 to 2250 meters.
Two-dimensional model of the Karaj site
Using the one-dimensional analysis and evaluation of the geological map of the area, two dimensional geological structure was rebuilt in studied profiles. Green and gray tuffs and igneous rocks of Karaj Formation outcrops in north of Karaj and constitute the Alborz Mountains. This Mountains eroded by the action of rivers and were deposited in the form of large alluvial fans. Coarse sandy sediments were deposited near mountains wherein energies of rivers and streams were extremely high (site 1 to 4). Furthermore, fine-grained sediments were deposited at far distances by decreasing in the energy of streams (site 5 to 9). Berberian et al (1985) divided B Formation in two parts: heterogeneous deposits of sand, gravel, rock and clay in north of Tehran (Qbn) and silts and clays of Kahrizak (Qbs) in south of Tehran. According to 1-D modelling, thickness of this layer is about 200 to 300 m which has been deposited on geology bedrock. As mentioned before, lower parts of Hezardareh Formation at the north of Karaj and Upper red Formation in the south west of Karaj are considered as geology bedrock. Upper Red Formation was deposited with unconformity on tuff-andesite of the Karaj basement at depths of 2000 to 2250 meters.
Conclusions
The use of empirical methods based on microtremor is an efficient way to estimate the site effects in Karaj city, although the use of earthquake records could provide better evidence of the depth and geometry of basement. One-dimensional modelling of shear wave velocity profiles obtained from downhole data and considering the engineering bedrock (> 760 m/s) at depths of 17 to 85 meters, is not a good way to estimate the dominant frequency of alluvium. By considering the greater depth of alluvium and using shear wave velocity profiles obtained from microtremor array, 1-D modelling was carried out for geology bedrock (1300 m/s). Therefore, peak frequency in transfer function at the range of 0.87 Hz has been associated with effective contrast at depths of 200 to 300 meters. It seems that Karaj basement (> 2500 m/s) with about 2 kilometers depth plays an important role in the production of low-frequency peaks in transfer function.
Aliakbar Momeni, Gholamreza Khanlari, Mojtaba Heidari, Yasin Abdilor,
Volume 11, Issue 1 (Vol. 11, No. 1 Spring 2017 2017)
Volume 11, Issue 1 (Vol. 11, No. 1 Spring 2017 2017)
Abstract
./files/site1/files/7Extended_Abstract.pdfExtended Abstract
(Paper pages 135-156)
Introduction
Many civil structures (e.g. tunnel walls, bridge pillars, dam abutments and road foundations) are subjected to both static and dynamic loads. Cyclic loading leads to occurring fatigue phenomenon. Fatigue is the tendency of materials to break, or the process of damage accumulation, under cyclic loading. It was found that the dynamic fatigue strength can be reduced by 30-70 percent on average compared to uniaxial compression strength. Different materials show different response when they are subjected to cyclic loading. Some materials become stronger and more ductile, while others become weaker and more brittle. Although it is clear that the mechanical properties of rock under dynamic loads varied dramatically from those under static loads, the nature of dynamic failure in rock remains unclear, especially in cyclic loading condition. Fatigue behavior of rocks was rarely studied in respect to other materials such as steel and soil. The performed researches on fatigue behavior of rocks indicated that fatigue life will be decreased by increasing load amplitude in logarithmic and exponentially pattern. Also, strain softening is the dominated behavior of rocks against cyclic loading. Furthermore, some parameters such as maximum load level, confining pressures, amplitude, and loading frequency have considerable effects on fatigue behavior of rocks. However, available data on fatigue behavior remain insufficient for solving the practical tasks of predicting rock bursts and earthquakes. Obtained results are inconclusive and sometimes discordant. The aim of the current work was to assess tonalite rock fatigue behaviour under different loading conditions to describe the fatigue damage process of the granitic rock.
Material and methods
Several core samples were prepared to perform this research. The core samples were prepared with a L/D ratio of 2.5 with an average diameter of 54 mm. Before the fatigue tests, the physical and mechanical properties of the rocks were measured. Uniaxial compressive strength test (UCS) has been done on 5 core samples. The tests were performed in the load-control mode with a 1.6 kN/s loading rate. The tests were conducted to obtain the physico-mechanical parameters of the rocks in static loading condition, and provided a reference for subsequent dynamic tests. The cyclic tests were performed in both load and displacement control modes. To record axial and lateral strains during the fatigue tests, four strain gauges have been employed with arrangement of two axial and two laterals. Also, three acoustic emission sensors were installed on top, mean and bottom of the core samples to record cracking sound. In order to doing the tests a servocontrol Instron machine with 500 kN capacity was employed. The fatigue tests were conducted with three different maximum loads, 1 Hz frequency, and constant amplitude (0.82 of uniaxial compressive strength). The maximum stress level (the ratio of maximum cyclic stress to static strength) was varied 0.80, 0.85, and 0.90. The amplitude level (the ratio of amplitude stress to static strength) ranged from 0.50 to 0.70 and 0.90. Finally, Multi stages loading with increasing amplitude were applied for the displacement control tests. The results of fatigue tests have been evaluated by fatigue damage parameters including maximum and minimum axial strain, maximum and minimum lateral strain, tangent and secant modulus, toughness and hysteresis energy.
Results and discussion
The obtained results indicated that during fatigue process failure occurs below the maximum strength loading condition as a result of accumulative damage. Analysis of the fatigue test results showed that the fatigue failure consisted of three stages: fatigue crack formation (initiation phase I), stable crack propagation (uniform velocity phase II), and unstable crack propagation resulting in a sudden breakdown (accelerated phase III). By comparing the axial and lateral deformation, it was found that lateral deformation is more sensitive to fatigue. At higher stress levels, considerable part of fatigue life is response to crake development, whereas at lower stress levels, crack acceleration phase of fatigue life is distinguishable. Descending trend of loading and unloading tangent modulus shows a scatter pattern. This behavior may be related to the calculation method and loading condition, as well as microstructure and behavior of the rock mass. In spite of tangent modulus results, the three-stages of damage process (especially phase I and II) for secant modulus in both loading and unloading conditions are clear. The result is due to the method of calculation and increase in axial strain with increasing number of cycles. Brittle behavior of this type of rock leads acceleration phase to be hidden and unclear in most of fatigue damage parameters. A dramatic decrease of toughness and hysteresis energy in the first few cycles is due to the closing of pre-existing micro fractures. In fact, during the initial cycle, the rock behaves in a more ductile fashion than in the next few cycles. Thereafter, toughness begins to increase slowly, then steadily, and finally rapidly. A similar behavior was found for hysteresis energy as well. This fact indicated that cracks generated in parallel to loading direction. Fatigue displacement control tests show a strain softening behavior for the granitic rocks. This behavior is highlighted in variation of maximum stress during the tests. This parameter, especially in final step of loading, shows distinguishable decreasing trend.
Conclusion
The tonalite rocks were subjected to uniaxial cyclic loading in both load and displacement control mode. The following conclusions were drawn from this research.
-Accumulated fatigue damage occurs in an obvious three-stage process. This is the result of the micro-fracturing mechanism in the fatigue process.
-By comparing axial and lateral strain damages, it was found that crack propagation occurred in the loading direction and crack opening occurred in the lateral direction. So, among fatigue damage parameters, lateral strain shows the best three-stage fatigue damage behavior.
- Strain softening was found as rock response to cyclic displacement control loading.
Majid Taromi, Maziar Hosseini, Seyed Mahdi Pourhashemi, Majid Sadeghi,
Volume 11, Issue 1 (Vol. 11, No. 1 Spring 2017 2017)
Volume 11, Issue 1 (Vol. 11, No. 1 Spring 2017 2017)
Abstract
./files/site1/files/3Extended_Abstract.pdfExtended Abstract
(Paper pages 51-72)
Introduction
Value engineering is considered an efficient alternative to improve design and construction process of urban tunneling projects. Application of value engineering techniques can provide investigating all aspects of a project in a team work, creative and short-time manner which contribute to precisely identify a project’s quality improvement issues, construction time and costs.
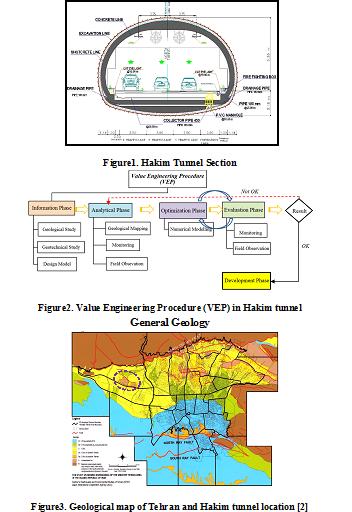
Hakim Expressway one of the capital's main highways in Tehran metropolis with 9 Km in length, starts from the junction of Resalat expressway and Kurdistan expressway after Resalat tunnel and ends in Lashgari expressway. The west extended this highway passing through the area of Chitgar forest park. Due to environmental constraints, the Hakim twin tunnels with cross-section of 186 m2 excavation areas and total length of 3256 m to the NATM/SEM method in this area were excavated (Figure 1).
In preliminary design of Hakim tunnel project, on category of excavation and support system was suggested. During the tunnel’s excavation operation, the behavior and classification of the tunnel were investigated from field observation, instrumentation and monitoring of geological models and subsequently, further excavation process was modified in accordance with value engineering. The aim of using value engineering approach in this project was to reduce the costs without any decrease in quality, employer satisfaction along with minimum risk and as well as improving operational and practical aspects. Ultimately, establishment of the value engineering approach on Hakim tunneling project leads to 10% reduction in construction costs as well as relevant quality with the least challenges (Figure 2).
General Geology
The city of Tehran is founded on Quaternary alluvium, which has been geologically classified by Rieben [1]. The city is located at the foot of the Alborz mountain range, which is basically composed of Eocene pyroclastic deposits (green tuff) and other volcanic rocks. The geology and the morphology of the Tehran region is similar to that for other cities located at the foot of mountains.
Rieben (1966) divided the Tehran coarse-grained alluvia into four categories, identified as A, B, C and D, where A is the oldest and D the youngest (Figure 3).
Hakim tunnel project locates on foothills of northern Tehran, crossing the hills of Chitgar forest park. Results of field surveys indicate that alluvial deposits in tunnel track belong to C (ramps and tunnel portal) and A formations (in most parts of tunnel track).
Geotechnical characterization
Table1 summarizes soil input parameters. Two soil types were considered for the model with 8- meter-height overburden. First layer (No.1) starts from surface with a 1 meter thickness. Second layer (No. 2) has 7 meter thickness.
Table1. Summary of the geotechnical parameters
| Parameter | Unit | Layer No. 1 | Layer No. 1 |
| Internal friction angle (CU) | Deg. | 29 | 33 |
| Cohesion (CU) | Kg/cm2 | 0.15 | 0.45 |
| Density | Kg/cm3 | 18.5 | 20 |
| Poisson ratio of unloading/reloading | Kg/cm2 | 0.2 | 0.2 |
| Secant deformation modulus | Kg/cm2 | 550 | 900 |
| Power of stress level of stiffness | 0.5 | 0.5 | |
| Stiffness unloading | Kg/cm2 | 1650 | 2700 |
Detailed analysis before excavation and continuation of studies led to two excavation and support classes purposed for Hakim tunnel. Both classes of excavation and support due to ground conditions are modeled and analyzed using software Plaxis. For verification, the results of numerical analysis using monitoring and field observations were compared during the tunnel excavation. The results of monitoring compliance with the results of numerical analysis were appropriate.
Implementation and construction costs were calculated for different sections of two excavation and support classes in accordance to contraction documents to evaluate the effect of optimization in design (Figures 6, 7)
.jpg)
Figure4. Excavation sequence in excavation and support class “A”
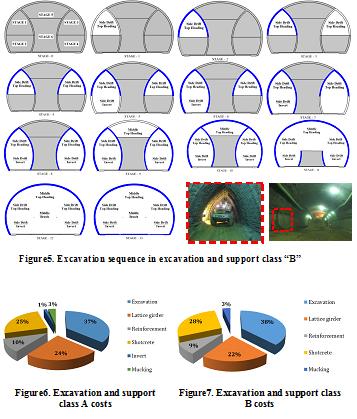
Results
Results indicate that in both classes maximum costs are related to excavation section while minimum costs are for invert and mucking. In all concrete spray operations there was just a %3.5 increase in costs. Overall savings in excavation and support was about %10 which is significant (Figure 8).

Figure8. Savings percentage comparison in excavation and support classes A and B
Mohammad Hosein Ghobadi, Seyed Hosein Jalali, Bahman Saedi, Noshin Pirouzinajad,
Volume 11, Issue 1 (Vol. 11, No. 1 Spring 2017 2017)
Volume 11, Issue 1 (Vol. 11, No. 1 Spring 2017 2017)
Abstract
./files/site1/files/5Extended_Abstract.pdf Extended Abstract
(Paper pages 91-114)
Introduction
Due to possibility of occurrence in various natural environments and the variety of natural and artificial factors that affect landslides, landslide has special importance in natural hazards. Depending on the landform, several factors can cause or accelerate the landslide. According to previous researches, Human activities, land morphology, geological setting, slope, aspect, climate conditions, proximity to some watershed features such as rivers and faults are the most important parameters. Landslides occur frequently each year and they can cause heavy losses which compensating some of them requires a lot of money and time.
Assessing landslide related hazards with only limited background information and data is a constant challenge for engineers, geologists, planners, landowners, developers, insurance companies, and government entities.
The landslide occurrence in terms of time and place are not easily predictable, for this reason, Landslide Hazard Zonation (LHZ) or Landslide Susceptibility Zonation (LSZ) maps are used to predict the happening of landslides. A landslide susceptibility map depicts areas likely to have landslides in the future by correlating some of the principal factors that contribute to landslides with the past distribution of slope failures. These maps are basic tools for land-use planning, especially in mountain areas. Landslide susceptibility mapping relies on a rather complex knowledge of slope movements and their controlling factors. The reliability of landslide susceptibility maps mostly depends on the amount and quality of available data, the working scale and the selection of the appropriate methodology of analysis and modeling.
Such maps are obtained by dividing of a region into near-homogeneous domains and weighting them according to the degree of possible hazard of a landslide. There are two ways to do landslide hazard zonation: (i) a qualitative approach that is based on expert knowledge of the target area and portrays susceptibility zoning in descriptive terms; and, (ii) a quantitative approach based on statistical algorithms. In the present study of landslide susceptibility zonation, bivariate statistical methods (information value, density area, LNRF, frequency ratio) were used. In bivariate statistical analysis, each factor map is combined with the landslide distribution map and weighting values based on landslide densities are calculated for each parameter class.
Materials and Methods
The best method for studying landslides, which has long been of interest to researchers, is hazard zonation. In this method due to the affecting factors in landslide occurrence, the study area is classified into areas with low to very high risk. Such zonation could be of great help in regional planning. Different methods have been developed for this purpose. In this research four bivariate statistical methods namely information value, density area, LNRF, and frequency ratio are used to investigate the hazard zonation in Poshtdarband region, Kermanshah province. The study began with the preparation of a landslide inventory map. The instability factors used in this study included geology, land use, normalized difference moisture index (NDMI), slope gradient, aspect, distance from faults, distance from surface water, distance from roads, profile curvature and plan curvature. Landslide area ratio was calculated in classes of effective factors maps and weighted by four bivariate statistical methods. In addition, landslide hazard zonation maps were obtained from algebraic sum of weighted maps with regard to breakpoints of frequency curve. Finally, by using density ratio (Dr) Index through all four methods hazard classes were compared and with the help of quality sum (Qs) and precision (P) indexes these four methods were compared and evaluated.
Results and Discussion
If the landslide susceptibility analyses are performed effectively, they can help engineers, contractors, land use planners, etc. minimize landslide. In this study, bivariate statistical methods were applied to generate landslide susceptibility maps using the instability factors. The bivariate approach computes the frequency of landslides with respect to each input factor separately, and the final susceptibility map is a simple combination of all the factors irrespective of their relative significance in causing landslides in a particular region.
In table 1 subclasses of instability factors which had the highest value in different methods, are summarized.
The density ratio indexes (Dr), quality sum indices (Qs) and precision indices (P) were used to compare the methods. By overlaying the landslide inventory map of the study area and landslide hazard zonation maps, quality sum (Qs) and precision (P) indices introduce a suitable model for the studied region, and density ratio index (Dr) introduces division precision among the zones or hazard classes in each zonation model.
Table1. subclasses of instability factors in different methods which had the
highest value
| factor methods | aspect | Slope | distance from surface water | land use | plan curvature | profile curvature | distance from fault | distance from the roads | NDMI |
| information value | N, NE | >40 | >1000 | forest | concave | concave | <500 | >1000 | -0.17_ -0.408 |
| density area | N, NE | >40 | >1000 | forest | concave | concave | <500 | >1000 | -0.17_ -0.408 |
| LNRF | SW, S | 10-20 | >1000 | pasture | Convex | convex | <500 | >1000 | -0.17_ -0.408 |
| frequency ratio | N, NE | >40 | >1000 | forest | concave | concave | <500 | >1000 | -0.17_ -0.408 |
Method precision (P) values for information value, density area, frequency ratio, and LNRF methods are 0.160826, 0.241024, 0.240672 and 0.16942 respectively.
Conclusion
- Frequency ratio, density area and information value methods showed that forest land use, slope and slope shape factors have the highest impacts on a landslide occurrence.
- The LNRF method showed that geology factors, pasture land use and distance from surface water had the greatest role in landslide making.
- For frequency ratio, information value, and density area methods, the effective factors in landslide are the same, however through the LNRF method, the three factors which have the greatest impact on landslide happening, are generally different from the three other methods.
- The density ratio values show that density area and frequency ratio methods respectively have more accuracy and applicability within all used methods for separating hazard classes in the study area.
- The quality sum (Qs) results indicate that although there are minor differences, the frequency ratio compared to the density area method was more accurate and more applicable for separating landslide hazard in the Poshtdarband region.
- The calculated results of P index indicated that among the used methods, the density area method with a nuance of the frequency ratio method is the most suitable method for the study area.
Mehdi Hosseini, Koroush Abdolghanizadeh,
Volume 11, Issue 2 (Vol. 11, No. 2 Summer 2017 2017)
Volume 11, Issue 2 (Vol. 11, No. 2 Summer 2017 2017)
Abstract
./files/site1/files/1.pdfExtended Abstract
(Paper pages157-174)
Introduction
Considering the fact that the estimation of mode
Materials and Methods
The tests were carried out on six types of rocks, namely gray sandstone,
tuff, lithic tuff, travertine, andesite, and limestone. Sandstone, travertine, and limestone are sedimentary rocks, while andesite is an extrusive igneous rock, and tuff and lithic tuff are pyroclastic rocks (pyroclastic rocks resulting from volcanic eruptions that harden by sedimentation). Therefore, the studied rocks have different origins. In order to carry out the Brazilian and the three-point bending test, cores were prepared from these blocks. In order to perform the three-point bending test, specimens with diameter of 73 mm with a thickness of 30 mm were used. The samples were cut in two semicircular by a cutting machine, and a notch with length of 15 mm is created by a diamond saw. Notch is vertical in the center of the semicircular samples.
The Brazilian test was performed on disc shaped specimens. In order to perform the Brazilian test, specimens with diameter of 51 mm and thick of 25 mm were used. The specimens are carefully placed under the curved jaws of the machine and then loaded until fracture.
Results and Discussion
A summary of the Brazilian and the three-point bending test results are presented in Table 1. The average value of test result pertaining to each rock is reported in Table 1.
Table 1. Summary of the Brazilian and the three-point bending test results
| Specimen | Tensile Strength (MPa) | Fracture Toughness (MPa√m) |
| Limestone | 3.74 | 1.23 |
| Sandstone | 7.14 | 1.63 |
| Tuff | 16.36 | 2.17 |
| Lithic Tuff | 4.34 | 1.01 |
| Andesite | 13.25 | 1.86 |
| Travertine | 8.27 | 1.14 |
In order to determine the relationship between the tensile strength and the fracture toughness, the tensile strength vs. fracture toughness diagram was plotted in Excel to obtain Eq. 1 and the coefficient of determination (R2) (Figure 1).
.jpg)
The coefficient of determination (R2) in Eq. 1 shows that almost 80 percent of the mode I fracture toughness variations can be estimated using the linear relationship (Eq. 1). The relationship is applicable for determining the mode I fracture toughness resulting from the three-point bending test on semicircular specimens containing a straight crack.
.jpg)
In the following, the results of this study are compared to those reported by Whittacker (1992) and Zhang (2002).
In order to examine the accuracy of the presented relationships, the Root Mean Square Error (RMSE) measure was used which is computed from Eq. 2. In the best case, RMSE is zero.
.jpg)
In the relationships,
Comparison of the obtained results indicate that the proposed relationship has the capability of precise estimation of the mode I fracture toughness of rocks.
Conclusion
Given the many difficulties associated with the direct estimation of fracture toughness, indirect estimation methods have been proposed. One of such methods is the estimation of mode I fracture toughness using tensile strength. A linear relationship with a coefficient of determination of 0.7977 was proposed. The accuracy of this relationship has been verified by comparing its results to those from previous studies.
Kobra Jafari, Naser Moghaddas, Alireza Mazloumi Bajestani, Azam Ghazi,
Volume 11, Issue 3 (Vol. 11 No. 3 Autumn 2017 2018)
Volume 11, Issue 3 (Vol. 11 No. 3 Autumn 2017 2018)
Abstract
Mohammad Hosein Ghobadi, Paria Behzadtabar,
Volume 11, Issue 3 (Vol. 11 No. 3 Autumn 2017 2018)
Volume 11, Issue 3 (Vol. 11 No. 3 Autumn 2017 2018)
Abstract
Rock anisotropy plays an important role in engineering behavior of rocks. Slates are anisotropic rocks which have long been used for gable roof, floor tiles, borrow materials, and other purposes. The slates studied in this research are calcareous and have a porphyro-lepidoblastic texture. To determine the role of the anisotropy on the tensile strength and fracture pattern, two variables including ψ (the core axis angle to foliation) and β (the angle between the axis of loading and foliation) in the Brazilian tests were used. The angles were selected at 15° intervals. Thus, for both ψ and β, seven angles of 0˚, 15˚, 30˚, 45˚, 60˚, 75˚, and 90˚ were selected (i.e., there are 43 possible modes). In order to name and examine the failure pattern, 11 models were proposed. The average value of the failure strength for the three stations varies from 3.21 MPa to 20.94 MPa. Based on the obtained results, there is a direct relation between the average tensile strength and density. A comparison between Brazilian test data under dry and saturation conditions shows that the saturated Brazilian tensile strength is 30.8% less than the dry Brazilian tensile strength. Moreover, the changes in fracture length with the changes in ψ and β indicate an inverse relation. Eventually, the average of tensile strength (σt) and strength anisotropy index (Ia) demonstrates that the influence of orientation angle (ψ) is much larger than that of foliation-loading angle (β).
Fariborz Dehghani, Hadi Shahir, Ali Ghanbari,
Volume 11, Issue 3 (Vol. 11 No. 3 Autumn 2017 2018)
Volume 11, Issue 3 (Vol. 11 No. 3 Autumn 2017 2018)
Abstract
In the narrow geosynthetic-reinforced retaining walls a stable rear wall exists in a short distance and
Sm Fatemiaghda, H Shahnazari, H Karami, M Talkhablou,
Volume 11, Issue 4 (Vol. 11, No. 4 Winter 1018 2018)
Volume 11, Issue 4 (Vol. 11, No. 4 Winter 1018 2018)
Abstract
Carbonate soils are different from silicate soils respect to their origination and engineering behavior. Particles of these soils are mainly residual or debris of sea animals or plants with large amount of calcium carbonate. They also may be chemical sedimentation of calcium carbonate over other soil particles in specific region of seas and oceans. The most important characteristic of these soils is the crushability of their aggregates under loading which is mainly due their shape and also small voids inside of them. Crushability and subsequent volume changes in carbonate soils have caused many engineering problems in some geotechnical structures such as ...../files/site1/files/0Extended_Abstract5.pdf
Bioavailability and Concentration of Heavy Metals in Soils and Plants near Irankuh mine Tailing Dams
Mahsa Rokhbar, A Qishlaqh, G Forghani,
Volume 11, Issue 4 (Vol. 11, No. 4 Winter 1018 2018)
Volume 11, Issue 4 (Vol. 11, No. 4 Winter 1018 2018)
Abstract
Introduction
Exploitation or processing of ores is usually associated with the production of a large amount of waste materials. These materials often have a high concentration of metals which can enter the environment through weathering or erosion. It is well-known that the measurement of the total concentration of metals cannot be an adequate for evaluating the pollution status of soil. Therefore, in most studies on soil contamination, bioavailability content of metals is determined by which can predicate the fate of the metals entering into the other parts of the environment such as plants, water or human food chain. The bioavailability of metals in the soil environment is the exchangeable and absorbable metals for plants, which depends on their exchangeability and absorption by soil organisms especially plants. This is also the function of the chemical form of each element in the soil. The main purpose of the present study was to measure the total concentrations along with the bioavailable content of metals in soils and plants around the Irankuh mine tailing dams.
Area of study
The Irankuh lead and zinc mine is located 20 kilometers southwest of Isfahan. This mine is of MVT type Pb-Zn deposit which occurred mainly in limestone and dolostone of lower cretaceous age. The Irankuh mine is an open-pit mine with annual extraction of 358 thousand of PbO and ZnO. The exploitation of mine is also associated with the production of a large amount of waste material which is piled in open dumps around the mine. The main minerals of ores are galena, sphalerite and pyrite.
Materials and methods
31 sampling sites were selected randomly for collecting agricultural soils around the tailing dams. Each soil sample is actually composite sample of four samples which are taken from a depth of 15 to 20 cm. Seven cultivated plants (Ocimum basilicum) were sampled from green houses in the vicinity of tailing dams. After drying and sieving, about 50g of the soils are chemically analyzed in order to determine the total concentration of the metals by the ICP-OES method. Plant samples after drying were changed to ash in the furnace at temperature > 500 C. The concentrations of metals (Zn, Pb and Cd) were then measured by Atomic Absorption Spectrometers in their stem, roots and leaves.
pH samples of soil were also determined using the EPA 9045 method. Walkley and Black method were used to measure the amount of organic matter. The cation exchange capacity (CEC) of soil samples was also determined based on EPA 9087 method. Soil texture determined using hydrometric method and then classified according to USDA classification. Diethylene Triamine Pentaacetic Acid (DTPA) extractable metals (bioavailable content) were determined using the method by Lindsay and Norvell (1978) and their concentrations in the DTPA extracts were determined by Atomic Absorption Spectrophotometer (AAS).
The metal transfer from soil to plant was calculated using the transfer factor (TF: metal content in plant divided by metal content in soil).
Results and discussion
The soil pH of the studied samples varies from 7.36 to 8.35. Cation exchange capacity (CEC) of soil samples was estimated to be in the range of 4 to 22.2 Meq/100 g. Also, the amount of organic matter in the studied soil samples varies from 0.17 to 3.43%. The relative high levels of soil organic matter are probably due to addition of organic manure to soil through agricultural activity. The total concentration of these three matls are significantly higher than their corresponding values in the crust implying that the mining activity and tailing dams greatly elevated the concentration of these metals in soils. Statistically, there is a significant positive correlation among Zn, Pb and Cd (at confidence level of 0.01) indicating that their potential source is the same or having similar geochemical behavior in the soil. The soil clay content showed a significant correlation at the level of 0.05 with Zn, Cd and Pb. This indicates that clay fraction plays a significant role in absorption of these metals in soil. According to the results of single extraction (DTPA method), the proportion of available content for Cd is higher than that of Zn and Pb. Cadmium is often characterized by its high mobility in soil media. Based on the correlation coefficients at the confidence level of 0.01, it is also observed that the increase in total concentration of Cd increased its bioavailability content in the soil consequently increase the availability of other elements in the soil. Therefore, it can be inferred that the availability of Cd in the soils of the study area is likely to be increased in the presence of Zn and Pb because in sites where the total concentration of Pb and Zn is high, the content of Cd availability has also elevated.
Based on the comparison of the average concentration of the metals in different parts of the plants, the concentration of metals is ordered as follows stem> leaf> root, which indicates the high root capacity for the accumulation of metals. The average transfer factor (TF) for Cd is obtained much higher than those of Zn and Pb. There is also a negative significantly correlation between the concentrations of Cd in the aerial parts of the plants and its bioavailability concentration in the soil. Also, there is positive and significant correlation between Zn and Cd for all three different parts and its bioavailability concentration in the soil. In the case of Pb, a significant correlation is observed between stem and root parts. This means that Cd and Zn after being absorbed by the root, are more likely being uptake by the plants due to high mobility of zinc. However due to less mobility of Pb, it is seemingly entered into the plant aerial parts after absorption by the root.
Conclusion
The concentration and degree of contamination of the studied soils is very high in terms of total Pb, Zn and Cd concentrations in agricultural soils around the Irankuh mine. The increased heavy metal contents in soils can be attributed to mining activity and tailing dams near cultivated lands. The measurement of the bioavailable content of these metals indicates that the Cd has the highest availability as compared to Zn and Pb. The average concentration of Pb and Cd in different parts of plant which is higher than the permissible limits, implying that the transfer of the available metal part (especially Cd) from the contaminated soil into the plant. Based on the calculated health risk assessment index in this study, it can generally be concluded that the gradual accumulation of these metals, especially in aerial parts of basil might have health hazards for local consumers. ./files/site1/files/0Extended_Abstract3.pdf
Ali Reza Najibi, Mohammad Ghafoori, Gholam Reza Lashkaripour, Mohammad Reza Asef,
Volume 11, Issue 4 (Vol. 11, No. 4 Winter 1018 2018)
Volume 11, Issue 4 (Vol. 11, No. 4 Winter 1018 2018)
Abstract
Introduction
Determination of in situ stress-direction and magnitude are prerequisite for any oil well drilling and oil field development such as hydraulic fracturing. One of the simplest and most widely used methods is called borehole breakout analysis. Breakouts are compression fractures made in the direction of minimum horizontal in situ stress (Sh), if drilling mud pressure be lower than optimum mud pressure. Some borehole imaging logs such as FMI, FMS and UBI are appropriate tools for wellbore fracture detection. These fractures are distinguished in the logs as dark and symmetrical points (or lines) on both sides of the well and are used as an indicator for in situ stress studies. The size and shape of these fractures are strongly depend on the magnitude of the in situ stress. Therefore, many researchers suggested that by analyzing the geometric shape of the borehole breakout is an appropriate technique for estimation of in situ stress components. .... ./files/site1/files/0Extended_Abstract7.pdf
Mahmoud Ataee , Saeed Ghanbari ,
Volume 12, Issue 1 (Vol.12, NO.1 Spring 2018)
Volume 12, Issue 1 (Vol.12, NO.1 Spring 2018)
Abstract
Drilling and cutting stones as types of the engineering operations have encountered a lot of extensive and determining applications in different technical and engineering aspects of the mining. Estimating the drillability and cutability of stones by using drilling equipment and diamond wire saw have important roles in estimating the expenses and also designing mines. In this article some samples of carbonate ornamental stones from different mines in Iran have been studied in order to estimate and predict the drilling and also cutability rate.
In order to evaluate the effect of the textural specifications on the rate of drilling and cutability, first a picture was provided from the thin microscopic surface of every stone sample and then the area, perimeter, diameter the longest diagonal and the shortest diagonal of the grains in the sections were determined and the other textural specifications were also determined through using mathematical relations and equations. After that the relationship between the abovementioned parameters with the drilling and cutting rate were determined by using univariate fitting. And finally to achieve more correlation coefficient multivariate fitting was applied for the data. Among the textural specifications affecting the drilling rate textural coefficient, the diameter of the grain, dequi, the ratio of the grain condition and the index of grain size homogeneity had a significant relationship with the drillability rate and also among those affecting the cutting rate, textural coefficient, the diameter of the grain, dequi, density, shape factor, index of interlocking, and the index of grain size homogeneity had significant relationships with the cutting rate and at the end the final equation to predicate the drillability and cutability was produced for these parameters../files/site1/files/121/AleeiAbstract.pdf
Gholamhosein Tavakoli Mehrjard, Fariba Motarjemi,
Volume 12, Issue 2 (Vol. 12, No. 2, Summer 2018 2018)
Volume 12, Issue 2 (Vol. 12, No. 2, Summer 2018 2018)
Abstract
Introduction
The general failure mechanism of soil element in geotechnical structures is shear failure under static and dynamic loads. Therefore, assessment of soils’ shear strength parameters is very crucial in the performance of geotechnical structures, especially in slope stability. Tavakoli Mehrjardi et al. (2016) showed that by increasing soil grain size in unreinforced soil masses, bearing capacity of foundation increases due to increasing shear strength parameters of soil mass. Furthermore, Tavakoli Mehrjardi and Khazaei (2017) found out that generally, for all reinforced and unreinforced conditions, cyclic bearing capacity was enhanced by increasing the medium grains size of backfills. Taking into account the deficiency of studies on the shear characteristics of soil, a series of large direct shear test have been carried out to investigate and to compare effects of the soil’s physical properties such as aggregate size and relative density, besides of normal stress, on the shear characteristics of the backfills.
Material and Test Program
In this study, three types of uniformly graded soils as fill materials with the medium grain size (D50) of 3, 6 and 12 mm were considered. These soils are classified as SP and GP in the Unified Soil Classification System. It should be mentioned that these materials can be used in railroad as ballast and in retaining walls as fill materials. The current study aims to investigate strength characteristics of the backfills, influenced by different parameters such as relative density of the fill materials, normal stress on the shear plane and aggregate size of the fill materials. To cover all the matters, 18 large-scale direct shear tests have been scheduled. These tests encompass two relative densities of fill materials (50% and 70% which represent medium dense and dense backfill, respectively), three aggregate sizes of fill materials (3, 6 and 12 mm- selected based on the scaling criteria on size of shear box) and three normal stresses (100, 200 and 300 kPa- these values cover rather low to high vertical stress in a soil element of common geotechnical projects) have been examined. It should be mentioned that, prior to shearing, the normal stress was applied to the specimens for a period of 1 h, in order to stabilize the soil particles from any possible creep. As all materials used in this research are of coarse-grained type and the experiments were performed under dry conditions, the displacement rate of 0.5 mm/min was selected. During the tests, the applied normal stress, displacement of the lower box, shear force mobilized at the interface and vertical displacements of the cap were continuously recorded.
Results and discussion
The curves of shear stress as a function of shear displacement and also shear displacement-vertical displacement for samples show that shear stress dropped down to a specific amount of residual shear strength
Conclusion
The current study, consists of 18 large-scale direct shear tests, aims to investigate shear characteristics of soil which influenced by different parameters such as relative density of the fill materials, normal stress at the shear plane and aggregate size of the fill materials. Eventually, the following conclusions are presented:
- Increasing relative density, soil particle size and normal stress have beneficial effect in shear strength improvement. But, the mechanism
sof each parameter in this enhancement is different. - The dilation rate of shear interfaces directly complies with changes in the ratio of applied shear stress to vertical stress. So, the maximum dilation angle and the maximum ratio
 mobilized at the shear plane have occurred around the same shear displacement.
 - Maximum values of friction and dilation angels have been occurred around the same shear displacement. Moreover, compaction effort leads to increase the required shear displacements to approach the maximum shear characteristics.
Mahmoud Behnia, Javad Tavakoli, Masoud Cheraghi Seifabad,
Volume 12, Issue 2 (Vol. 12, No. 2, Summer 2018 2018)
Volume 12, Issue 2 (Vol. 12, No. 2, Summer 2018 2018)
Abstract
Introduction
The rock block volumes are formed due to the intersection of discontinuities in the jointed rock mass. The block dimensions affected by joint spacing, joint orientation, joint sets, are taken to be the most important parameters determining the rock mass behavior, strength parameters, and deformations. In the numerical modeling using distinct element method, the creation of the discontinuities can affect the final results very much. Using 3DEC software, it is possible to create joint sets in four conditions: regular and persistent, regular and non-persistent, non-regular and persistent, irregular and non-persistent. As an important point to consider, the major effect of block dimensions on rock mass behavior, strength parameters and deformation modulus can help to decide which one is most suitable to indicate the real conditions of rock mass. As explained in the previous studies, the use of persistent joints leads to the block dimensions being considered as small ones. In this way, due to the high strength of intact rock compared to the joints, the possibility of instability increases.
Material and methods
In this research, from quantitative point of view, Geological Strength Index (GSI) is calculated, based on block dimensions as an influential parameter, to consider the most appropriate case for creating joints in the numerical method. In this regard, according to valuable studies in Bakhtiari dam structure, the characteristics of discontinuities system and GSI of rock mass are utilized to come up with real conditions. Then, the modeling is done with different conditions of joints, block volume distribution, GSI for each case, and the results are compared with quantitative ones. And then the most suitable case for creation of joints in numerical modeling is suggested by using 3 DEC software, regarding the blocks volumes, type of distribution function, and GSI value. Also, the accuracy of this finding is investigated for other structures, independently of input parameters, by making changes in spacing, and joints persistence as two effective parameters in rock blocks dimensions. Owing to the difficulty in the accurate definition of joints persistence, which is related to dimensions of the location, the numerical models for joint persistence are done in an acceptable level in order to create blocks with high conformity in terms of the dimensions. Then, the comparison is made between block dimensions from perspectives of numerical models and GSI values, to choose the best ones showing high conformity with real conditions.
Results and discussion
The comparison of the modeling results using creation of joints in different cases with quantitative results obtained according to geological strength shows that the created block volumes are not properly distributed due to the creation of joints as irregular ones in the two cases of persistent and non-persistent. In this case, the blocks volume changes from a few centimeter to cubic meter, and as the block dimensions increase, the created blocks become bigger. Thus, according to the created blocks volume and the obtained GSI range, the creation of joints is not a suitable method as an irregular one. The creation of regular and persistent joints is not an appropriate method either, as the most created blocks are small, and blocks volume distributions do not comply with quantitative distribution. But with creation of joints as regular and persistent ones, the distribution function of blocks volume in numerical method and quantitative method is log normal. Therefore, according to the created blocks dimensions and GSI range using 3DEC software, the most suitable case is the creation of joints as regular and non-persistent ones.
Conclusion
According to the obtained results in the four cases, when the joints are considered only as regular and non-persistent ones, the blocks volume range is more compatible with real conditions and follows log normal distribution. Thus it can be concluded that the suggested method for creation of joints in the numerical modeling using 3DEC software is more suitable than others considering the rock blocks dimensions and their distributions. This method can be utilized in any structure to accurately define the persistence of joints regarding created blocks dimension.
Mahmoud Babalar, Ali Raeesi Estabragh, Jamal Abdolahi,
Volume 12, Issue 2 (Vol. 12, No. 2, Summer 2018 2018)
Volume 12, Issue 2 (Vol. 12, No. 2, Summer 2018 2018)
Abstract
Introduction
Contaminants can be categorized into organic and inorganic groups. Organic contaminants are carbon based, and their presence in waste forms may be as a single contaminant associated with inorganic contaminants, or a suite of complex mixtures which may be toxic at very low concentrations. Organics of greatest environmental concern are usually refined petroleum products, chlorinated and non-chlorinated solvents, manufactured biocides, organic sledges and substances from manufacturing processes. Most contamination due to organics are associated with accidental spills and leaks, originating from equipment cleaning, maintenance, storage tanks, residue from used containers and outdated material (Yong and Mulligan, 2004). Transport and fate of organic contaminants are important. Organic contamination migrations are due to advection (by fluid flow through soil) and diffusion, but other forms of transport e.g. infiltration may also contribute to migration (Environment Agency, 2002). The response of the soil to a contaminant depends upon the type of soil and the nature of the contaminant. The sensitivity of soil to contaminants depends upon the type of soil (such as particle size, mineral structure, bonding characteristics between particles and ion exchange capacity) and the nature of contaminants. Fang (1997) defined a sensitivity index (ranging from 0 to 1) to different types of soil. Sensitivity of sand and gravel (0.01 to 0.1) is much lower than clay particles (0.6-0.9). There are a number of techniques for remediation of contaminated land. These include physical (washing, flushing, thermal, vacuum extraction, solvent extraction), chemical (stabilization and solidification) and bioremediation techniques. However, the applicability and feasibility of different methods for remediation are dependent on many factors such as soil characteristics (soil type, degree of compaction and saturation), site geology, depth of contamination, extent of contaminant in lateral direction, topography, surface and ground water and the type and amount of contaminants. Thermal treatment and using surfactants are the most popular methods for remediating the soil contaminated with petroleum compounds. In this research remediation of a soil contaminated with different percentages of gasoline was studied through physical techniques in laboratory. The applied physical techniques were thermal technique and use of two different kinds of surfactants. The obtained results were compared with each other and discussion was performed.
Material and methods
Soil, gasoline and surfactant are the basic materials that were used in this work. The soil that was used in this testing program was
Results and discussion
The results of Atterberg limits (LL, PL and PI) for the contaminated soil (with 5 and 10 % gasoline) indicated that the values of them are increased with increasing the percent of gasoline. These values are nearly the same as natural soil after remediation with thermal method and surfactants. The grain size distribution curves were determined for the natural soil, contaminated soil with 5% and10% gasoline and soil remediated by thermal and surfactant techniques. The results showed that by using thermal technique the percent of clay is decreased and the percent of sand and particularly silt is increased by increasing temperature. The results of grain size distribution for the soils remediated by SDS and Tween 80 showed that the percent of clay is reduced but the percent of silt and sand are increased. Comparing the results of the two surfactants shows that the effect of Tween 80 in reduction of the percent of clay is more than SDS. The results showed that after thermal treatment, the maximum dry unit weight decreases and the optimum water content increases. For the contaminated soil with gasoline a reduction in maximum dry unit weight is observed compared with natural soil. The effect of SDS and Tween 80 on soil remediation is reduction in maximum dry unit weight and optimum water content. The results of compression strength showed that adding gasoline to soil causes a reduction in final strength and this reduction is a function of gasoline percent. The results also indicated that the strength of remediated soil by thermal or surfactant techniques, is reached nearly to the strength of natural soil. Scanning electron microscopy (SEM) tests were performed on the samples in order to observe the microstructure of the samples in different conditions (natural and contaminated with different percent of gasoline). The results of SEM showed that the structure of soil is changed by contamination to gasoline. It can be said that the gasoline causes reduction in the thickness of DDL because of low dielectric constant and hence a flocculated structure is formed. In the flocculated structure due to attractive forces, the fine particles paste to each other and form coarse particles. Therefore, variations in the Atterberg limits and compaction parameters can be resulted from forming new structure by adding gasoline. These results of compression strength are not in agreement with the theory of diffuse double layer (DDL). The reduction in dielectric constant would cause a flocculated structure in soil and the strength of the contaminated soil should be increased in comparison with the natural soil. It can be said the viscosity of gasoline cause reduction in the strength of contaminated soil.
Conclusion
In this experimental work a cohesive soil was contaminated with 5% and 10% of gasoline. The experimental tests showed that the properties of contaminated soil are different from natural soil and the change in the properties is a function of gasoline percent. The contaminated soil, was remediated by thermal treatment and also using two surfactants. The results also showed that using surfactants is more effective than using thermal method in soil remediation, and can treat the soil nearly to its original condition.
-Base on the SEM analysis results, adding gasoline to the soil, will change the soil micro structure to a flocculated one.
-The gradation curves show that adding gasoline to the soil will change the gradation from finer to coarser.
- Contamination to gasoline will change the compaction parameters of the soil, and will reduce the soil final strength significantly.
- The results show that using thermal method and surfactants is effective in remediating the soil, but it is more effective to use surfactants.
References
Yong, R.N., Mulligan,. “Natural attenuation of the contaminants in soil”, CRC press, Boca Raton, FL (2004).
Fang, M.Y. “Introduction to Environmental Geotechnology”, CRC Press,FL.USA, (1997).
Sassan Narimannejad, Alireza Jafari-Nedoshan, Ali Massumi, Abdollah Sohrabi-Bidar, Ali Ghanbari1,
Volume 12, Issue 2 (Vol. 12, No. 2, Summer 2018 2018)
Volume 12, Issue 2 (Vol. 12, No. 2, Summer 2018 2018)
Abstract
Introduction
Local site conditions considerably influence all characteristics of the ground strong motion including the domain, frequency content, and duration. The level of such an effect could be considered as a function of geometry, properties of the materials embedded in the underlying layers, the site topography, and properties of excitement. Site effect fall into two categories: a) the effect of the surface soft layers triggered by the shear velocity differences between the soil layers and b) the surface and subsurface topography effects that lead to the wave reflection and refraction based on the site geometry, and subsequently enhance the level of amplification.
Since most cities have been constructed in the vicinity of or on sedimentary basins, geotechnical earthquake engineering devotes particular attention to effects of the sedimentary basins. Basin edge curvature deposited with soft soils are capable to trap the body waves and generated surface waves within the deposit layers. Such waves could create stronger and lengthier vibrations than those estimated in a 1D analysis that assumes the shear waves to be vertically propagated.
Although critically important, the 2D effect of the site has not been included in seismic codes and standards of the world. This might be due to the fact that the site effect depends on a number of parameters such as the site geometry, the type of wave excitement, properties of the materials, etc. that in return make it almost out of the question to make predictions about the effect. This study was an effort to compare the responses of four sedimentary basins with hypothetical geometries of rectangular, trapezoidal, elliptical, and triangular shapes in order to examine the effect of the geometrical shape of the basin on its responses and the extent of the response sensitivity to the excitation frequency of the wave. The study assumed the edge to depth proportion to be both constant and equal in all four basins so that the effect of the geometrical shape could be equally examined and compared in all four basins.
Material and methods
In order to validate the results of the sedimentary basin modeling, firstly, ABAQUS finite element software was used to create a free field motion of a semi-circular alluvium valley in accordance with Kamalian et al. (2006) and Moassesian and Darvinsky (1987). Then, the results from the model were compared with those from the above mentioned studies. The following descriptions are to present the model in details.
To evaluate the geometrical effect of the sedimentary basin on its response, the authors relied on the software to examine four sedimentary basins with the fundamental frequency (2.04 Hz). The basins enjoyed rectangular, trapezoidal, elliptical, and triangular geometrical shapes with a constant edge to depth proportion (49m to 300m respectively). The implicit method was also applied to perform the dynamic analysis. The materials were all viscoelastic and homogeneous. The soil behavior/treatment model was considered to be of a linear nature. The Rayleigh damping model was used to specify the damping level. The soil element was a plane strain and SV waves (the Ricker wavelet) were used for seismic loadings in a vertical dispersion. The side boundaries (right and left) of the model were of a combinational type (viscous and free field boundaries); the down side boundary was composed of viscous. To achieve higher levels of wave absorptions, heavy columns were used as the free filed columns.
Next, it was the time to conduct the 1D analysis of the site. Three waves were in use in order to examine the effect of the frequency content of the excitation load on the basin response: 1) a wave with the dominant frequency of 1Hz that was out of the frequency range of all basins (2.04 Hz), a second wave with the dominant frequency of 2Hz that was close to the fundamental frequency of all basins, and a third wave with the dominant frequency of 4Hz. The waves were applied to a 2Dmodel. The results were compared with those obtained from a 1Dmodel in terms of the timing.
Then, the basin responses to all three waves (1, 2, and 4 Hz) were subjected to an individual analysis in order to examine the sensitivity of each basin response to its geometrical shape. Results indicated that while the responses of the rectangular and trapezoidal basins were significantly more sensitive to the excitation frequencies, the elliptical and triangular basins showed more stable behaviors to such frequencies. The final stage of the study was dedicated to examine the site 2D effect during the ground motion.
Results and Conclusions
According to the results of the present study, it could be suggested that the geometrical shape of the sedimentary basin has a significant effect on the responses of the field of seismic waves and that it could result in so different responses from the ones attained after a 1D analysis of the site. In addition, the pattern of the seismic waves’ responses is highly dependent on the geometrical shape and the frequency content of the seismic load. Also, the location where the maximum horizontal acceleration occurs along with the sedimentary basin depends on the excitation wave and varies accordingly. Further, it could be suggested that the site 2D effect results in both considerable amplification and an increase in the length of ground motion.
The results of the 2D analysis showed remarkable differences with their 1D counterparts: a 1.45 larger response for the rectangular basin, a 1.28 larger response for the trapezoidal basin, a 1.22 larger response for the elliptical basin, and a 1.19 larger response for the triangular basin.
With the frequency of 1 Hz where the excitation frequency is out of the basin range (i.e. the excitation frequency is below the lowest frequency of basin), the sedimentary basin did not show any signs of amplification and chaos (unlike two other frequencies); instead, it was a cause for de-amplification.
The frequency of 2 Hz that is subject to resonance resulted in amplifications (absent in 1D analysis) and there are traces of a reduction in the acceleration responses near to the edges of the basins. The proportion of the amplification (in the center of the basins) in 2D to 1D analysis was 1.4 for the rectangular basin, 1.28 for the trapezoidal basin, 1.22 for the elliptical basin, and 1.15 for the triangular basin.
Masoud Zare Naghadehi, Seyed Davood Mohammadi, Mostafa Karimi,
Volume 12, Issue 2 (Vol. 12, No. 2, Summer 2018 2018)
Volume 12, Issue 2 (Vol. 12, No. 2, Summer 2018 2018)
Abstract
Introduction
The selection of the best subsurface exploration methods corresponding to geotechnical, topographical and economic circumstances of the project is one of the most effective factors in the success of a tunneling project. On the other hand, the development of a decision model and consequently choosing the most suitable alternatives are complex tasks. Therefore, prioritizing and selecting the best subsurface exploration methods, as the main aim of this study, can reduce the economic and social costs associated with the execution of a tunneling project. For this purpose, ten experts from tunneling community have been asked to weigh the chosen criteria of the problem in this research. A methodology utilized in this study is the Analytical Hierarchy Process (AHP) which proved useful in engineering decision-making problems. The other method is TOPSIS, one that has continuously been used in decision making in the recent decades. These two techniques have been combined and utilized in this work to rank the aforementioned exploration methods.
Material and methods
The study area is located about 109 km far from Shahrekord city amid the Zagros mountains. The Sabzkooh tunnel development plan has been under evaluation in the time that this research was being done. The geology of the area majorly encompasses sedimentary rocks which have been outcropped as folds, faults, and fractured and altered zones. However, the variety of the lithological units in the tunnel route is high, and units of limestone and shales also exist over the path.
In the first step, geological and topographic maps were produced for the study area, and general information from the tunnel path was collected and examined. Suitable exploration methods were evaluated, and six main methods were chosen to be considered as the alternatives of the study including (a) discontinuities study, (b) Lugeon tests, (c) RQD, (d) Geo-electric, (e) Gravimetry, and (f) Seismic methods. Moreover, nine criteria ranging from “volume of the available information” and “environmental impact” to “cost” and “accuracy” of the employed methods were taken into account. A pairwise comparison matrix was then developed, and the experts were asked to fill it out. The importance of each criterion was then simply calculated through this matrix. Alternatives pairwise comparison matrices were also filled out and, in this manner, the alternatives could be ranked using the AHP technique. Next, the TOPSIS technique was employed for the same purpose using a rather different process.
Results and discussion
Both AHP and TOPSIS techniques show very close results for ranking of the alternatives in this study. They rank the three Seismic, Geo-electric and Discontinuities studies methods as the best ones for the considered tunneling project. The only difference between these two techniques is how they determine the worst method. The AHP ranks the Lugeon as the last rank among the six methods whereas the TOPSIS determines the RQD as the least reliable method of exploration for the Sabzkooh tunnel project.
Conclusion
The prioritization and the subsequent selection of the most reliable exploration methods for an underground excavation project is a crucial task amid technical decisions. In this research, two major multi-criteria decision-making methods including AHP and TOPSIS were considered and applied for the Sabzkooh tunnel in Iran. The results indicate a high agreement between the two methodologies even though these two approaches decide differently on the least reliable methods to be applied.
Mohsen Sabermahani, Valiollah Ghalehnovi, Hamidreza Elahi, Shaham Atashband,
Volume 12, Issue 3 (Vol. 12, No. 3, Autumn 2018)
Volume 12, Issue 3 (Vol. 12, No. 3, Autumn 2018)
Abstract
Introduction
Jet-grouting is a soil improvement technique which was originated in Japan. Jet-grouting method consist of disaggregation of soil or weak rock and its mixing with, and partial replacement by, a cement agent; the disaggregation is achieved by means of a high energy jet of a fluid which can be the cement agent itself. Jet-grouting techniques can be grouped into three main systems, which are named single, double and triple fluid, depending on the number of fluids injected into the subsoil, namely, grout (usually water–cement mixture), air and grout, and water plus air and grout. In the beginning, jet grouting was mostly viewed as a means of improving the subsoil properties for the foundations of large structures. Nowadays, its application are diversified for use in foundations, excavations, tunneling, water barriers and underpinning. This paper studies foundation improvement by jet-grouting in one of Iran northern cities and seeks the optimum design parameters for jet-grout columns in saturated and unsaturated sand. Results of cement grouting as one-fluid jet-grouting method together with site geotechnical characteristics are presented. Diameters of jet-grouted columns, uni-axial strength of soil-cement cores and core recovery index are surveyed as the most important parameters for performance assessment of improved foundation and the primary design is modified and the project completed based on the results.
Material and methods
Design parameter of jet-grout columns were assumed according to guidelines and previous expertise as follows
Results and discussion
It is observed that the average diameter of columns that are constructed in unsaturated sand with design parameters mentioned in material and methods section, is one meter and the average diameter of columns that are constructed in saturated sand with the same density as unsaturated sand is 0.8 meter. This could be due to the dissipation of fluid jet energy under the water.
The modified obtained values from uniaxial compression test show that the strength of samples varies from 28 to 90 kg/cm2. By omitting the lower, an upper 5 precent of the data as irrelevant data, the average UCS of the remaining part is equal to 57 kg/cm2. By applying a geotechnical safety factor of 2.5 to the modified
Conclusion
-It is observed that utilizing one-fluid jet-grout method with 450 bar injection pressure in saturated silty sand with mean SPT number 30, rod withdrawal speed of 0.5 cm/sec and grout density of 1600 gr/cm3 will result in 80 cm diameter jet-grout columns, while the same parameters will result in a 100 cm column in unsaturated sand which can be due to fluid jet energy dissipation under water.
-Considering the common design parameter for jet-grout columns in Iran, which are the same as the design parameters discussed in this paper, the UCS of get-grout columns in near shore silty sand with a safety factor of 2.5 is about 40 kg/cm2.
./files/site1/files/123/6Extended_Abstract.pdf
Nazanin Mahbubi-Motlagh, Ahmad-Reza Mahboubi Ardakani,
Volume 12, Issue 3 (Vol. 12, No. 3, Autumn 2018)
Volume 12, Issue 3 (Vol. 12, No. 3, Autumn 2018)
Abstract
Introduction
Many studies have shown that the lime stabilization method can increase the strength and hardness of cohesive soils. Increasing these parameters is dependent on several factors such as curing time, lime content, clay minerals, soil particle size and moisture content.
When lime is added to moisture clay soils, a number of reactions occur to improve soil properties: 1- short-term and 2- long-term reactions. The short-term reactions include cation exchange, flocculate and carbonation; whereas, the long-term reactions include pozzolanic reactions. Since adding lime changes clay particles structure, it can change shear strength parameters.
Using geogrids as reinforcement in soil mass creates a composite system in which the soil tolerates compressive stresses. The elements of the reinforcement are also responsible for tensile stresses and interaction the reinforcement elements and soil increases the strength and ductility. The mechanism of stress transfer is based on interaction between soil and reinforcement. Accordingly, one of the most important issues in the analysis and design of reinforced soil structures is determination of frictional resistance parameters in soil-geogrid interface (adhesion and friction angle) which is discussed in this paper.
Stability and performances of reinforced earth structures significantly depend on the shear behavior of interface soil-geogrid in different weather conditions. Factors such as rainfall, seepage of groundwater and seasonal changes influence on soil moisture content. Changes in moisture content or soil dry density change interface soil-geogrid resistance. Increasing moisture content reduces the shear strength of reinforced soil and sometimes leads to large deformation or failure of system.
In this study, clayey soil with low plasticity (CL), hydrated lime for soil stabilization and two types of geogrid with different aperture size for reinforcing were used. In order to improve the brittle behavior of lime stabilized soils and to increase ductility of the samples, in the present study, lime stabilization and geogrid reinforcement was investigated, simultaneously. The interface shear strength parameters of treated soil with different lime content-geogrid and reinforcement coefficient were determined by direct shear tests. In addition, to study the effect of moisture content on interface shear strength soil-geogrid, all samples were subjected to shear in optimum and higher moisture content because the long-term performance of reinforced cohesive soils exposed to seasonal variations is evaluated.
Material and methods
The selected soil for the study is clayey soil from south region of Tehran, Iran. According to Unified Soil Classification System (USCS), the soil was classified as CL (clay of low plasticity).
In this study, three series of specimens were prepared and tested as follows:
- Stabilized samples with 0, 2, 4 and 6% lime for 7 days curing time
- Reinforced samples by geogrid (with and without transverse ribs of geogrid)
- Reinforced stabilized samples with different lime contents (0, 2, 4, 6 and 8%) by geogrid (with and without transverse ribs of geogrid) for 7 days curing times
Direct shear tests were carried out on specimens based on ASTM D5321 at constant horizontal displacement rate of 1 mm/min.
Results and discussion
The results reveal that the shear strength of the stabilized soil increased and there are maximum values in an optimum lime content which is about 4%. Increasing lime content to an optimum lime content of clay caused the maximum changes in clay minerals because of cementitious and pozzolanic reactions and increases the strength of the clayey soil. Reduction of strength by adding lime to the soil more than the optimum content may be caused by the following reasons:
1. Stopping pozzolanic reactions because of finishing reactance during reaction
2. Making difficult the release of limewater (Ca OH 2) in the cementitious context of soil.
Until SiO2 and AL2O3 are not finished, pozzolanic reactions continue and produce cementitious product, thus the shear strength increases and improves the long-term performance of the stabilized soils.
Reinforced soil samples have higher shear strength relative to samples without reinforcement subjected to the same normal stress. This increase in shear strength is mainly attributed to the interlocking of soil particles that penetrate through geogrid apertures. In addition, geogrids restrain particles´ movement and thus increase the mobilized frictional resistance at particle contact points.
Increasing in lime content to 4% (optimum lime content in this study) has significant effect on the development of adhesion and then decreases gradually with increasing of lime content from 4 to 6%, while friction angles remain constant approximately.
Adhesion and friction angles decrease with increasing moisture content.
The results show that the reinforced stabilized specimen with 4% lime has the maximum value of reinforcement efficiency. The increase in moisture content can significantly reduce the reinforcement efficiency.
It is clearly observed that the reinforcement coefficient of reinforced stabilized sample by geogrid that has smaller aperture opening size (4Í4 mm) is higher than reinforced stabilized sample by another geogrid (10Í10 mm) in optimum and higher than optimum moisture content.
Conclusion
One hundred and twenty samples in 3 specimen categories including lime treated, reinforced and reinforced treated samples were prepared for the current study for 7 days curing time in optimum content and higher than optimum content. The main results can be concluded as:
The test results indicate that the shear strength of stabilized clayey samples increases after 7 days curing time due to pozzolanic reactions.
The results show that reinforced samples have higher shear strength relative to unreinforced samples.
Adhesion and friction angles and reinforcement efficiency decrease with increasing moisture content.
The reinforcement coefficient of reinforced stabilized sample by geogrid 1 that has smaller aperture opening size is higher than by geogrid 2. In general, interaction between particles and geogrid with smaller mesh size is stronger because of matching the size of soil particles and meshes../files/site1/files/123/8Extended_Abstract.pdf
Javad Khalaji Pirbalouti, Naser Hafazi Moghadas, Gholam Reza Lashkaripour,
Volume 12, Issue 3 (Vol. 12, No. 3, Autumn 2018)
Volume 12, Issue 3 (Vol. 12, No. 3, Autumn 2018)
Abstract
Introduction
Hazardous waste (solid, liquid or contained gases) is a waste with properties that make it potentially dangerous or harmful to human health or the environment. Site selection and suitable conditions for hazardous wastes landfill is considered as the final stage of waste management that they have high sensivity. The purpose of this study is to identify prone areas to hazardous waste landfill for Chaharmahal and Bakhtiari province using geographic information systems (GIS) as an important tool for the analysis of potential sites and the Analytical Hierarchy Process (AHP) and to provide solutions to optimize the positioning is executed. Firstly, criteria and limitations of environmental, economic, social and physical were determined, then layers of the criteria in GIS were prepared. In this study, the inappropriate areas were first removed from the model, and the suitability of remaining regions as a categorize criterion considered. Categorize criteria for paired comparison using AHP as an efficient tool for determining the relative weight parameters are used to measure and rank the expert choice application imposed. Then the implement paired comparison of the relative weights of the criteria and sub-criteria and criteria for each category were determined. After calculating the net weight and normal weight, normal weight based on standard maps in the GIS environment has been classifieds. Finally, by combining maps and applying criteria FA map, the final map was extracted.
Material and methods
The purpose of this research is to identify and prioritize appropriate areas of special waste disposal using multi-criteria decision-making methods. In order to locate using the GIS, first, identifying, evaluating and selecting criteria and constraints for the construction of landfill, in order to reduce the economic, environmental, and health costs. In the multi-criteria evaluation method, criteria are the basis of decision making, so that a set of criteria is combined and combined to achieve a single combination. In this paper, a two-stage process was used to locate the landfill site. In the first stage, which is recognized as the identification stage of prohibited areas according to different criteria, the study area is divided into two appropriate and inappropriate classes that will be eliminated as prohibited areas for the construction of landfills. In the second stage, the various factors are ranked and weighted according to the relative importance and, finally, places that receive the appropriate points are introduced as areas susceptible to the dumping of special wastes. In order to obtain the digital data of the criteria in the GIS environment from the digital elevation map (DEM), the specifications of the piezometric wells information are available from the regional water organization of the province. The available data such as geological map of the province at a scale of 1: 250,000, satellite images of Landsat and map of land suitability of the province, rainfall data of the synoptic stations of the province and the data of the Environmental Protection Agency were used. In general, the following steps have been taken in the process of locating:
- Identification of effective locating factors (limitations and factors)
- Digitizing and providing the required layers of information using the GIS package
- Identify and eliminate prohibited and inappropriate areas for landfill construction
- Classification and weighting of the factors and layers of information sought
- Integration of layers and the provision of a mapped rate and talent to determine the appropriate areas.
Results and discussion
1. Set limits
In this study, in order to select suitable sites for landfill particular, the criteria and limitations were determined. The information layers for each of the criteria were provided in the GIS environment.
2. Classification and weighting criteria
In the second stage, which is the stage of weighting and rating, of 14 effective criteria were used in site selection. AHP is one of the most efficient techniques, multi-criteria decision. This method is based on comparing factors and to study various scenarios to give managers and decision makers. This technique is one of the most comprehensive system designed for decision-making with multiple criteria.
3. Editor hierarchy to locate
Hierarchical structure is a graphical representation of a real complex problem, which mainly target the problem and at the next general criteria, sub-criteria and options are the way in AHP is used to calculate points based on comparison test.
4. Shipping Weight Matrix Binary comparison and decision-making
After compiling a hierarchical structure, the next step is to evaluate the elements by comparing the test. In general, if the number of options and criteria respectively m and n are then paired comparison matrix of options for comparison matrix m × m and n × n matrix will be a couple of criteria.
5. After weighing and preparing the normal weight of the options, the normalized weights in the GIS environment were added to the criteria map and the Raster and Weighted layers of each criterion were prepared. Due to the wide area of the studied area, the size of each pixel was 50 * 50 m. Then, using the Raster Module, the Criterion Map was combined and a zoning map was prepared for the special waste disposal site.
Conclusions
In the present study, according to various criteria influencing the Hierarchical Analysis Process for prioritizing the criteria in decision making, based on the results, the talent map of the area was prepared for special waste dumping, in which according to the final score of the layers, the area was classified into four appropriate, relatively suitable, relatively inappropriate and inappropriate classes. Suitable areas were 12.64%, relatively fairly 32.47%, relatively inappropriate 30.43%, and inappropriate zones 9.58% of the area of the talent map were included.
./files/site1/files/123/5Extended_Abstract.pdf
Related Websites
Site Keywords
نشریه, Academic Journal, Scientific Article, کلمه شماره یک, کلمه شماره یک, کلمه شماره یک, کلمه شماره یک, کلمه شماره دو, کلمه شماره یک, کلمه دوVote

© 2024 CC BY-NC 4.0 | Journal of Engineering Geology
Designed & Developed by : Yektaweb